A researcher was interested in studying the effects of job insecurity on employee job attitudes. Half of the research participants were randomly assigned to experience high insecurity (manipulated by announcing 50% layoffs) and half were assigned to experience low insecurity (announcement of 5% layoffs). In addition, the researcher was also interested in whether or not the method by which the layoffs were to occur would influence attitudes and perceived fairness. Therefore, half of the research participants were assigned to a fair layoff condition (i.e., layoffs determined by job performance) and half were assigned to an unfair condition (i.e., layoffs determined by favoritism). Employees were asked to make ratings on several issues: how important their jobs were ("job importance"), the extent to which they intended to quit working for the organization ("turnover intentions"), their perceived chances of being laid off ("chances of being laid off"), and perceptions of fairness ("perceived fairness"). Finally, they were asked to decide whether they wanted to quit working for the organization or remain employed with the organization ("decision to quit"). '
Contingency Table
A contingency table can be defined as the visual representation of the relationship between two or more categorical variables that can be evaluated and registered. It is a categorical version of the scatterplot, which is used to investigate the linear relationship between two variables. A contingency table is indeed a type of frequency distribution table that displays two variables at the same time.
Binomial Distribution
Binomial is an algebraic expression of the sum or the difference of two terms. Before knowing about binomial distribution, we must know about the binomial theorem.
1-


Given information:
The data represents the opinions of employees of several characteristics.
The characteristics are: Layoff condition, fair or unfair method, job importance, turnover intentions, chances of being laid off, perceived fairness and decision to quit.
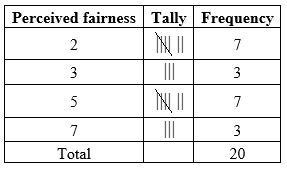
Construct a frequency distribution of scores reflecting employees perceived fairness:
Frequency distribution:
The number of times each value repeats is the frequency of that particular event. The frequencies are calculated by using the tally mark.
Here, the number of times each value of perceived fairness score repeats is the frequency of that particular value of perceived fairness score.
All the possible values of perceived fairness score are 7, 2, 5 and 3.
The frequency distribution for perceived fairness is obtained from the calculation given below:

Step by step
Solved in 3 steps with 2 images


