A researcher records the frequency distribution for a basketball player shooting free throws until a miss occurs. (For example: Make, Make, Make, Make, Miss happened 6 times.) Makes Followed By A Miss Frequency


Please complete all parts

Note:
Hi there! Thank you for posting the question. As your question has more than 3 parts, as per the policy, we have solved only the first three subparts for you. If you need any specific subpart to be answered, please re-submit the question by specifying the subpart number or name.
(a1). Construct a frequency histogram for the given data:
The data represents the frequency distribution for a basketball player shooting free throws until a miss occurs.
EXCEL software is used to construct a histogram for the given measured data.
Software Procedure:
The step-by-step procedure to construct a histogram using EXCEL software is given below:
- Open an EXCEL file.
- Enter the values of Makes followed by a miss in column A and name it as Makes followed by a miss.
- Enter the values of Frequency in column A and name it as
- Select Data and go to Insert tab.
- Select Charts > All charts > Column > Clustered column.
- Click OK.
- In format data series change the gap width to
The frequency is shown below:
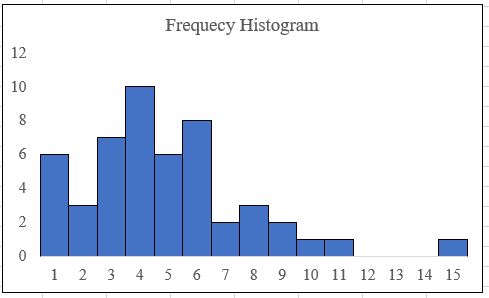
Observation: From the frequency histogram, the data is positively skewed.

Step by step
Solved in 4 steps with 2 images


