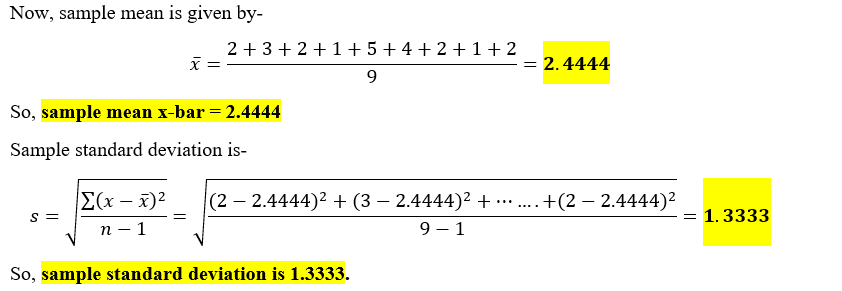
A researcher is testing the effect of a new flu vaccine on absenteeism from work. A sample of n=9 employees are randomly selected from the normally distributed population and given the vaccine; then, the researcher measures how many times they were absent in the subsequent year. If the mean number of absences in the entire organization (i.e., in the population) are 4 per year, can the researcher conclude that the vaccine had an impact on absenteeism, and if so, how large was the effect? Use an a of .05. Be sure to show all 5 steps. Absences: 2 3 2 1 5 4 2 1 2 Step 1: Which of the following correctly represents the null and alternative hypothesis for the mentioned sample
Contingency Table
A contingency table can be defined as the visual representation of the relationship between two or more categorical variables that can be evaluated and registered. It is a categorical version of the scatterplot, which is used to investigate the linear relationship between two variables. A contingency table is indeed a type of frequency distribution table that displays two variables at the same time.
Binomial Distribution
Binomial is an algebraic expression of the sum or the difference of two terms. Before knowing about binomial distribution, we must know about the binomial theorem.
35-


Given information-
The population mean, μ = 4 per year
Sample size, n = 9
Significance level, α = 0.05

Step by step
Solved in 2 steps with 2 images


