A researcher has a sample of 49 plants, and wants to describe the average plant height. The expected value of the plant heights is 8.2, with a standard deviation of 7 inches. What is the probability that the sample average height is greater than 9.2? O .5 .8414 .1586 (answer) O .0521
![**Question 1: Probability and Sample Averages**
A researcher has a sample of 49 plants and wants to describe the average plant height. The expected value of the plant heights is 8.2, with a standard deviation of 7 inches. What is the probability that the sample average height is greater than 9.2?
- ○ 0.5
- ○ 0.8414
- ○ 0.1586 (answer)
- ○ 0.0521
**Question 2: Estimating Variance**
Suppose \( X_1 \) and \( X_2 \) are two random variables with \( E(X_1) = 1 \), \( E(X_2) = 1 \), \( V(X_1) = 3 \), \( V(X_2) = 1 \). If \( Y = \frac{X_1}{X_2} \), what is a good estimate of the variance of \( Y \)?
- ○ 17
- ○ 2
- ○ 2.5
- ○ 13 (answer)](/v2/_next/image?url=https%3A%2F%2Fcontent.bartleby.com%2Fqna-images%2Fquestion%2F709a45c3-dbce-453b-a11a-e3f0d8d98627%2F64a85b5f-ee90-4c3d-9d36-81f7744a00e7%2F09ndm6.png&w=3840&q=75)
![](/static/compass_v2/shared-icons/check-mark.png)
Since you have asked multiple question, we will solve the first question for you. If you
want any specific question to be solved then please specify the question number or post
only that question
Obtain the probability that the sample average height is greater than 9.2.
The probability that the sample average height is greater than 9.2 is obtained below as follows:
Since, the sample is greater than 30, it is clear that the sampling distribution of the sample is approximately normally distributed.
Mean of sampling distribution of the sample mean is
Thus, the mean of sampling distribution of the sample mean is 8.2.
Obtain the standard deviation of the sampling distribution of the sample mean.
The Standard deviation of sampling distribution of the sample mean is given below:
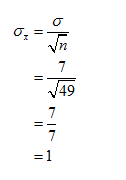
The Standard deviation of sampling distribution of the sample mean is 1
Step by step
Solved in 2 steps with 4 images
![Blurred answer](/static/compass_v2/solution-images/blurred-answer.jpg)
![MATLAB: An Introduction with Applications](https://www.bartleby.com/isbn_cover_images/9781119256830/9781119256830_smallCoverImage.gif)
![Probability and Statistics for Engineering and th…](https://www.bartleby.com/isbn_cover_images/9781305251809/9781305251809_smallCoverImage.gif)
![Statistics for The Behavioral Sciences (MindTap C…](https://www.bartleby.com/isbn_cover_images/9781305504912/9781305504912_smallCoverImage.gif)
![Elementary Statistics: Picturing the World (7th E…](https://www.bartleby.com/isbn_cover_images/9780134683416/9780134683416_smallCoverImage.gif)
![The Basic Practice of Statistics](https://www.bartleby.com/isbn_cover_images/9781319042578/9781319042578_smallCoverImage.gif)
![Introduction to the Practice of Statistics](https://www.bartleby.com/isbn_cover_images/9781319013387/9781319013387_smallCoverImage.gif)