A report in Ohio states that the mean cost for eye insurance is $150 a year with a standard deviation of $26. (population standard deviation). Test if the mean cost for eye insurance in KY is different that OH. A random sample of 80 people is taken with mean cost found to be $ 180. Does this differ from what was reported for OH? a - .05. Create an Ho and Ha. Select appropriate test. Decision Rule. Calculate the test statistics. Conclusion with comparison to alpha or critical value. this would be a two tailed test t test


A report in Ohio states that the
this would be a two tailed test
t test
Test whether the population mean cost of eye insurance is equal to 150 or not:
Denote the population mean as μ, and the population standard deviation as σ.
Given that, the population mean cost of eye insurance is μ = 150, the population standard deviation in cost of eye insurance is σ = 26.
The hypotheses are given below:
Null hypothesis:
H0 : μ = 150
That is, the population mean cost of eye insurance is equal to 150.
Alternative hypothesis:
H1 : μ ≠ 150 (Two tail test).
That is, the population mean cost of eye insurance is not equal to 150.
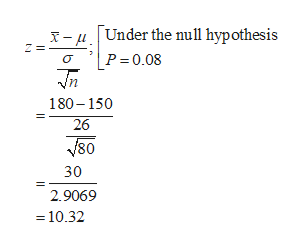
Obtain the test statistic value.
The sample mean cost of eye insurance is x-bar = 180. The sample size is n = 80.
The test statistic value is obtained as 10.32 from the calculation given below:
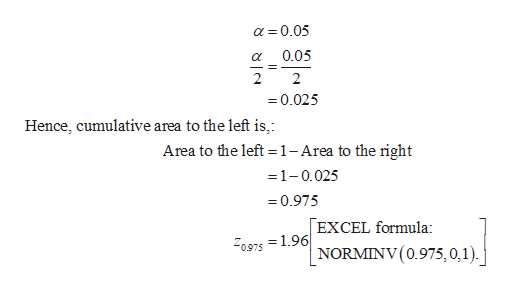
Obtain the critical value:
The level of significance is α = 0.05.
From the standard normal distribution area values the critical value is obtained as 1.96 from the calculation given below:

Step by step
Solved in 6 steps with 2 images


