A process considered to be in control measures an ingredient in ounces. Roberto Baggio, a quality inspector took 20 samples, each with 8 observations as follows: thats in the pictuer after that using this information, obtain three-sigma (i.e., z=3) control limits for a mean control chart and control limits for a range chart, respectively. It is known from previous experience that the standard deviation of the process is 0.693. First: perform all actions and calculations needed to answer the question. All equations/calculations needed to be fully written STEP by STEP. No short calculations or direct answers/results will be accepted. This applies to the calculations for both types of control limits (mean and range). Second: Explain the process followed to identify each type of control limit and any observations made in the problem-solving process.
A process considered to be in control measures an ingredient in ounces.
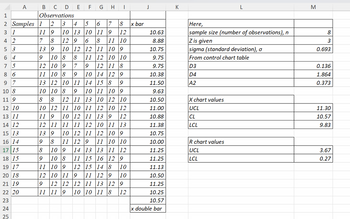
Roberto Baggio, a quality inspector took 20 samples, each with 8 observations as follows:
thats in the pictuer
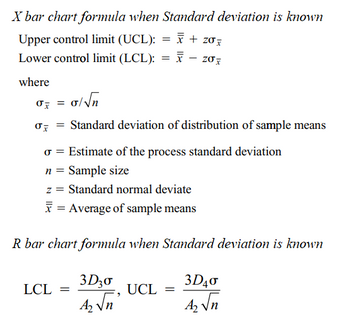
after that using this information, obtain three-sigma (i.e., z=3) control limits for a mean control chart and control limits for a range chart, respectively. It is known from previous experience that the standard deviation of the process is 0.693.
First: perform all actions and calculations needed to answer the question.
All equations/calculations needed to be fully written STEP by STEP. No short calculations or direct answers/results will be accepted.
This applies to the calculations for both types of control limits (mean and range).
Second: Explain the process followed to identify each type of control limit and any observations made in the problem-solving process.
thank you very much

Trending now
This is a popular solution!
Step by step
Solved in 5 steps with 10 images

thank you for your answer i found something similar on bertleby but the working out is different and the answers are slighilty different too i am not sure which one to use:
this is the answer that i found:
this are his answers but in the picture is working out
X chart values
UCL 11.30
CL 10.57
LCL 9.83
R chart values
UCL 3.67
LCL 0.27


