A poll was taken of 100 students at a commuter campus to find out how they got to campus. The results were as follows: 42 said they drove alone, 28 rode in a carpool, 31 rode public transportation, 9 used both carpools and public transportation, 10 used both a carpool and sometimes their own cars, 6 used public transportation (buses) and also their own cars; and 4 used all three methods. Given this information: How many of the students used NONE of these three types of transportation ? [
A poll was taken of 100 students at a commuter campus to find out how they got to campus. The results were as follows: 42 said they drove alone, 28 rode in a carpool, 31 rode public transportation, 9 used both carpools and public transportation, 10 used both a carpool and sometimes their own cars, 6 used public transportation (buses) and also their own cars; and 4 used all three methods. Given this information: How many of the students used NONE of these three types of transportation ? [
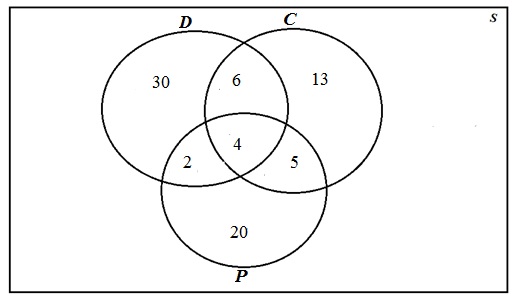
The event D is defined as student drove alone, event C is defined as student rode in a carpool, event P is defined as student rode public transportation.
There are 42 said they drove alone, 28 rode in a carpool, 31 rode public transportation, 9 used both carpools and public transportation, 10 used both a carpool and sometimes their own cars, 6 used public transportation (buses) and also their own cars; and 4 used all three methods. By using this information then Venn diagram is,

Trending now
This is a popular solution!
Step by step
Solved in 2 steps with 1 images


