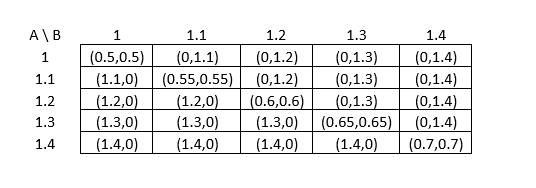
A painting by famous painter Renoir is on sale in a first price auction . Bidders are A and B. The minimum bid is $ 1 billion , and bids must be made in minimum $ 100 million increments . If both bidders bid the same amount , the winning bidder is determined by drawing lots ( winning probability is 50 percent ) . Bidder A assesses the value of the painting at $ 1.4 billion , and bidder B assesses it as $ 1.2 billion . Create a pay - off matrix in the range of $ 1 billion to $ 1.4 billion and resolve the game .
Contingency Table
A contingency table can be defined as the visual representation of the relationship between two or more categorical variables that can be evaluated and registered. It is a categorical version of the scatterplot, which is used to investigate the linear relationship between two variables. A contingency table is indeed a type of frequency distribution table that displays two variables at the same time.
Binomial Distribution
Binomial is an algebraic expression of the sum or the difference of two terms. Before knowing about binomial distribution, we must know about the binomial theorem.
A painting by famous painter Renoir is on sale in a first price auction . Bidders are A and B. The minimum bid is $ 1 billion , and bids must be made in minimum $ 100 million increments . If both bidders bid the same amount , the winning bidder is determined by drawing lots ( winning
We are given the following bid values for A and B
Bid value of A = $1.4 billion
Bid value of B = $1.2 billion
Here, we are assuming that aim of the bidders is to get the painting at the minimum possible cost. The incentive is to bid at each step since the probability of winning the bid would be 1/2.
The pay-off matrix is given down below in the form of a 5X5 Table.
The values are given as $ Billion.

Step by step
Solved in 3 steps with 1 images


