A mathematician drilled a hole in a die, filled it with a lead weight, and then proceeded to roll it. The results are given in the following frequency table. Click the icon to view the frequency table. a. According to the data, how many times was the die rolled? 200 (Simplify your answer.) b. How many times was the outcome greater than 2? 141 (Simplify your answer.) c. What percentage of outcomes were 6? 16% (Type a whole number.)
A mathematician drilled a hole in a die, filled it with a lead weight, and then proceeded to roll it. The results are given in the following frequency table. Click the icon to view the frequency table. a. According to the data, how many times was the die rolled? 200 (Simplify your answer.) b. How many times was the outcome greater than 2? 141 (Simplify your answer.) c. What percentage of outcomes were 6? 16% (Type a whole number.)
MATLAB: An Introduction with Applications
6th Edition
ISBN:9781119256830
Author:Amos Gilat
Publisher:Amos Gilat
Chapter1: Starting With Matlab
Section: Chapter Questions
Problem 1P
Related questions
Question
Is this correct? Ive had two different tutors give me different answers so I just need the right one please

Transcribed Image Text:A mathematician drilled a hole in a die, filled it with a lead weight, and then proceeded to roll it. The results are given in the following frequency table.
Click the icon to view the frequency table.
a. According to the data, how many times was the die rolled?
200 (Simplify your answer.)
b. How many times was the outcome greater than 2?
141 (Simplify your answer.)
c. What percentage of outcomes were 6?
16% (Type a whole number.)
d. List the relative frequencies as decimals or integers, not percentages, that correspond to the given frequencies. Complete the table below.
Outcome
1
2
3
Relative frequency
0.145
0.15
0.215
0.19
0.14
4
5
6
0.16
(Type integers or decimals rounded to the nearest thousandth as needed.)
e. List the cumulative frequencies that correspond to the given frequencies. Complete the table below.
Outcome
1
2
3
4
5
6
Cumulative frequency
0.145
0.295
0.51
0.7
0.84
1
(Simplify your answers.)
C
Data table
Outcome Frequency
1
29
2
30
3
4
5
6
43
38
28
32
Q
Print
Done
- X
Expert Solution
This question has been solved!
Explore an expertly crafted, step-by-step solution for a thorough understanding of key concepts.
This is a popular solution!
Trending now
This is a popular solution!
Step by step
Solved in 4 steps with 2 images

Follow-up Questions
Read through expert solutions to related follow-up questions below.
Follow-up Question
well here is the second part then. Thanks for wasting my question.

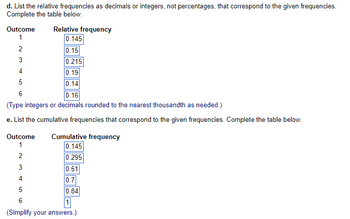
Transcribed Image Text:d. List the relative frequencies as decimals or integers, not percentages, that correspond to the given frequencies.
Complete the table below.
Outcome
1
2
3
4
5
6
0.16
(Type integers or decimals rounded to the nearest thousandth as needed.)
e. List the cumulative frequencies that correspond to the given frequencies. Complete the table below.
Outcome
1
2
3
4
Relative frequency
0.145
0.15
0.215
0.19
0.14
5 6
Cumulative frequency
0.145
0.295
0.51
0.7
0.84
1
(Simplify your answers.)
Solution
Recommended textbooks for you

MATLAB: An Introduction with Applications
Statistics
ISBN:
9781119256830
Author:
Amos Gilat
Publisher:
John Wiley & Sons Inc

Probability and Statistics for Engineering and th…
Statistics
ISBN:
9781305251809
Author:
Jay L. Devore
Publisher:
Cengage Learning

Statistics for The Behavioral Sciences (MindTap C…
Statistics
ISBN:
9781305504912
Author:
Frederick J Gravetter, Larry B. Wallnau
Publisher:
Cengage Learning

MATLAB: An Introduction with Applications
Statistics
ISBN:
9781119256830
Author:
Amos Gilat
Publisher:
John Wiley & Sons Inc

Probability and Statistics for Engineering and th…
Statistics
ISBN:
9781305251809
Author:
Jay L. Devore
Publisher:
Cengage Learning

Statistics for The Behavioral Sciences (MindTap C…
Statistics
ISBN:
9781305504912
Author:
Frederick J Gravetter, Larry B. Wallnau
Publisher:
Cengage Learning

Elementary Statistics: Picturing the World (7th E…
Statistics
ISBN:
9780134683416
Author:
Ron Larson, Betsy Farber
Publisher:
PEARSON

The Basic Practice of Statistics
Statistics
ISBN:
9781319042578
Author:
David S. Moore, William I. Notz, Michael A. Fligner
Publisher:
W. H. Freeman

Introduction to the Practice of Statistics
Statistics
ISBN:
9781319013387
Author:
David S. Moore, George P. McCabe, Bruce A. Craig
Publisher:
W. H. Freeman