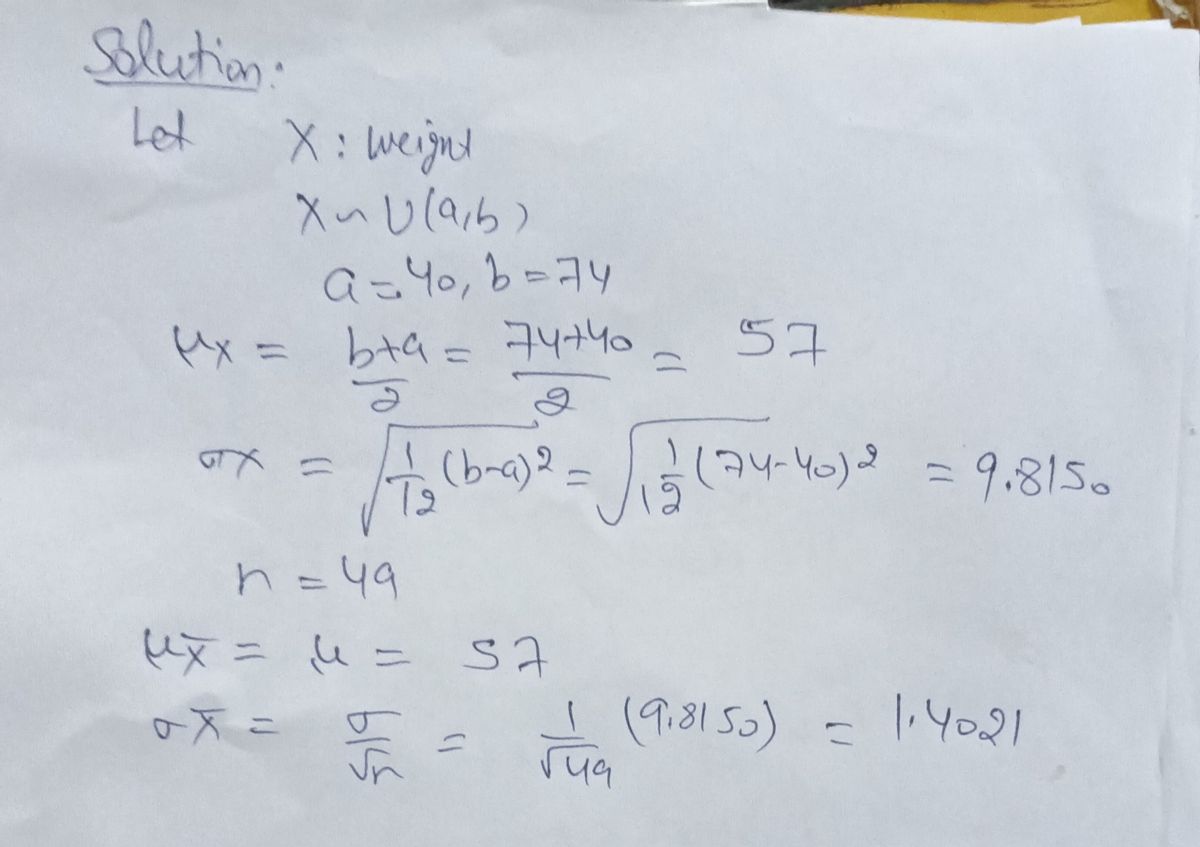
A manufacturer produces 54-pound lifting weights. The lowest actual weight is 40 pounds, and the highest is 74 pounds. Each weight is equally likely so the distribution of weights is uniform. A sample of 49 weights is taken
Q: Find the mean of the sampling distribution of sample means using the given information. Round to one…
A: Mean()=76standard deviation()=14sample size(n)=49
Q: Refer to the table of sample values in Section 8.2 Exercise 6 of the text. Find the values of the…
A: The R-chart is one of the control chart which is used to analyses the process variability (in terms…
Q: Suppose that the average waiting time for a patient at a physician's office is just over 29 minute n…
A: Since you have asked multiple question, we will solve the first question for you. If you want any…
Q: Identify the type of sample ( Experimental or Observational) Then tell if the sample is biased 9.…
A: 15 households are selected from the Houston area. This is the example of cluster sampling .
Q: Identify the two samples as independent samples or dependent samples. A training program assessment…
A: When the two groups of samples are somehow related, then the groups of samples are called dependent…
Q: Among 1815 randomly selected high school students surveyed by the Centers for Diseases Control, 300…
A: Given X=300 n=1815
Q: Consider these sample data: x1=12, x2=6, x3=4, x4=14. a. Find n. b.Compute ∑xi.…
A:
Q: Determine and o, from the given parameters of the population and sample size. H=85, o = 18, n= 36
A: Given,μ = 85σ = 18n = 36
Q: Identify the population and sample. In a random sample of California residents 78 said they had…
A:
Q: Identify the sampling techniques used in each scenario. surveying movie-goers as they exited the…
A: Introduction: It is required to identify the sampling technique used.
Q: The heights (inches) and foot lengths (cm) of 33 college men are shown in the dataset. Student…
A: Given: The given regression equation: Y = 0.253 + 0.384X Intercept a = 0.253 Slope b = 0.384 Where,…
Q: Calculate the sample size from the following information: E = 0.5, a= 5, c = 0.95
A: Solution-: Given: σ=5,M.E.=E=0.5,c=0.95 We find sample size, n=?
Q: There are six sisters and a family. Their ages are 7 years, 10 years, 15 years, 15 years, 20 years,…
A: Assume that the random variable x defines the ages of the sisters in the family.
Q: Decide if the following statement are true or false. If the statement is false, please correct it.…
A: Given statement is : The sample mean is denoted by ?μ and is a point estimate for the population…
Q: 0.845 ľyx2 0.791 Txx2 = 0.371
A: Solution : Given : n=5 k =2 ryx1= 0.845 ryx2 = 0.791 rx1x2=…
Q: Determine u, and o, from the given parameters of the population and sample size. H=71, o = 6, n = 36
A: It is given that, Mean value of certain population, μ = 71 and The standard deviation of a certain…
Q: e icon to view the histograms and boxplots. Histograms and Boxplots e shape of each histogram. shows…
A: It is an important part of statistics. It is widely used. Since the question has multiple sub parts…
Q: A dotplot for the distribution of the number of drinks per week of 10 randomly-selcte adults is…
A: It is given that the data set from the dotplot is:0, 1, 3, 3, 3, 4, 5, 6, 6, 9
Q: Find the population variance for the following data set: 13,23,26,17,21
A: Given data set: 13,23,26,17,21
Q: A college football coach was interested in whether the college's strength development class…
A: From the provided information, we can assume that a maximum lifting weight of 4 people recorded,…
Q: Bottles of purified water are assumed to contain 250 milliliters of water. There is some variation…
A: Claim : The mean amount of water in all the bottles filled that day differs from the target value of…
Q: The Fish and Game Deparment stocked Lake Loomis with fish according to the following percentages:…
A: Consider that p1, p2, p3, and p4, are the proportion of catfish, bass, bluegill and pike,…
Q: In systematic sampling, the population is 550 and the selected sample size is 50. The sampling…
A:
Q: Find the estimated standard error for the sample mean for n = 8 and SS= 5042.
A: Given n=8, SS=5042
Solution
Step by step
Solved in 2 steps with 2 images
- For the following sample data, find M: 8 , 2, 2, 5, 3.determine whether the samples are independent or dependant. To test the effectiveness of a drug, cholesterol level are measured in 60 men and 60 women after the treatment.The heights, in inches, of the four members of a barbershop quartet of singers are listed below. 72,68,67,73 Find the population variance for this data set. Round to one decimal place if necessary.
- 20 computer screens were randomly selected from a large collection of computer screens in a company’s warehouse. These 20 computer screens are referred to as the: test statistic. parameter. population. sample.Atlanta area animal shelters euthanize more animals per year than most other major city shelters. The following stem-and-leaf display shows the number of homeless cats and dogs that had to be euthanized each year in the Atlanta area for the period 1985-2004. Describe the distribution (shape, center, spread, unusual features). Choose the best answer for the question above: a. The distribution of the number of cats and dogs that were euthanized is unimodal, ranging from 81,100 to 90,100 euthanized. The center of the distribution is at around 85,500. b. The distribution of the number of cats and dogs that were euthanized is skewed to the right, and has several modes, with gaps in between. One mode is clustered between 87,000 and 90,000 euthanized, a second mode at 84,000, and a third mode with a cluster between 81,000 and 82,000. c.The distribution of the number of cats and dogs that were euthanized is bimodal. The upper cluster is between 89,000 and 90,000 euthanized, with a center at…Please show all your work to receive full credits. The following are sample data provided by a moving company on the weights of six shipments, the distances they are moved, and the damage that that was incurred: Weight (1,000 pounds) Distance Damage (1,000 miles) (dollars) X1 X2 y 4.0 1.5 160 3.0 2.2 112 1.6 1.0 69 1.2 2.0 90 3.4 0.8 123 4.8 1.6 186 a) Fit an equation of the form y bo + b1 x1 + b2 x2 b) Use the equation obtained in part (a) to estimate the damage when a shipment weighting 2200 pounds is moved 1100 miles. Hint: Use the given equation to solve for bo, b1 and b2 and then put it back in y= bo + bị x1 + b2 X2 X2
- Consider these sample data: x1=15, x2=9, x3=3, x4=22. a. Find n. b. Compute ∑xi. c.Determine x. a.n=A college football coach was interested in whether the college's strength development class increased his players' maximum lift (in pounds) on the bench press exercise. He asked four of his players to participate in a study. The amount of weight they could each lift was recorded before they took the strength development class. After completing the class, the amount of weight they could each lift was again measured. What is being tested in this situation and what distribution will be used to conduct the test? Group of answer choices a.Two independent means, normal distribution. b.Single population mean, use the t-distribution. c.Single population mean, use the normal distribution. d.Two independent proportions, use the normal distribution. e.Two independent means, use the Student’s-t distribution.Please scroll down to see the entire question. The quality control manager of an automobile parts factory would like to know whether there is a difference between the proportion of defective parts produced on different days of the work week. Random samples of 100 parts produced on each day of the week were selected, with the following results: Result: Mon Tues Wed Thurs Fri # of defective parts: 12 7 7 10 14 # of non-defective parts: 88 93 93 90 86 At 5% level of significance, is there evidence of a significant difference in the proportion of defective parts produced on the various days of the week (A ) Step-1: State the hypotheses ( H0 and H1 ), and identify the claim A. H0: Proportion of defective parts is not the same for the days of the week. H1: Proportion of defective parts is the same for all days of the week B. H0: Proportion of defective parts is dependent on the days of the week H1: Proportionof defective parts is…
- A student wishes to determine the average life-span of a household light bulb. She randomly collects 15 light bulbs. The issue that may arise from her survey is… The bias will be high. The accuracy will be low. The precision will be low. The standard error will be too low.The number of regular season wins for 10 college football teams in a given season are given below: 15 5 13 | 1 2 10 15 4 7 What is the population variance? Simplify your answer. Round to the nearest hundredth as needed.Consider a sample with data values of 27, 25, 20, 15, 30, 34, 28, and 25. Compute the 19th, 24th, 65th, and 75th percentiles. If needed, round your answers to two decimal digits. Percentile Value 19% 24% 65% 75%