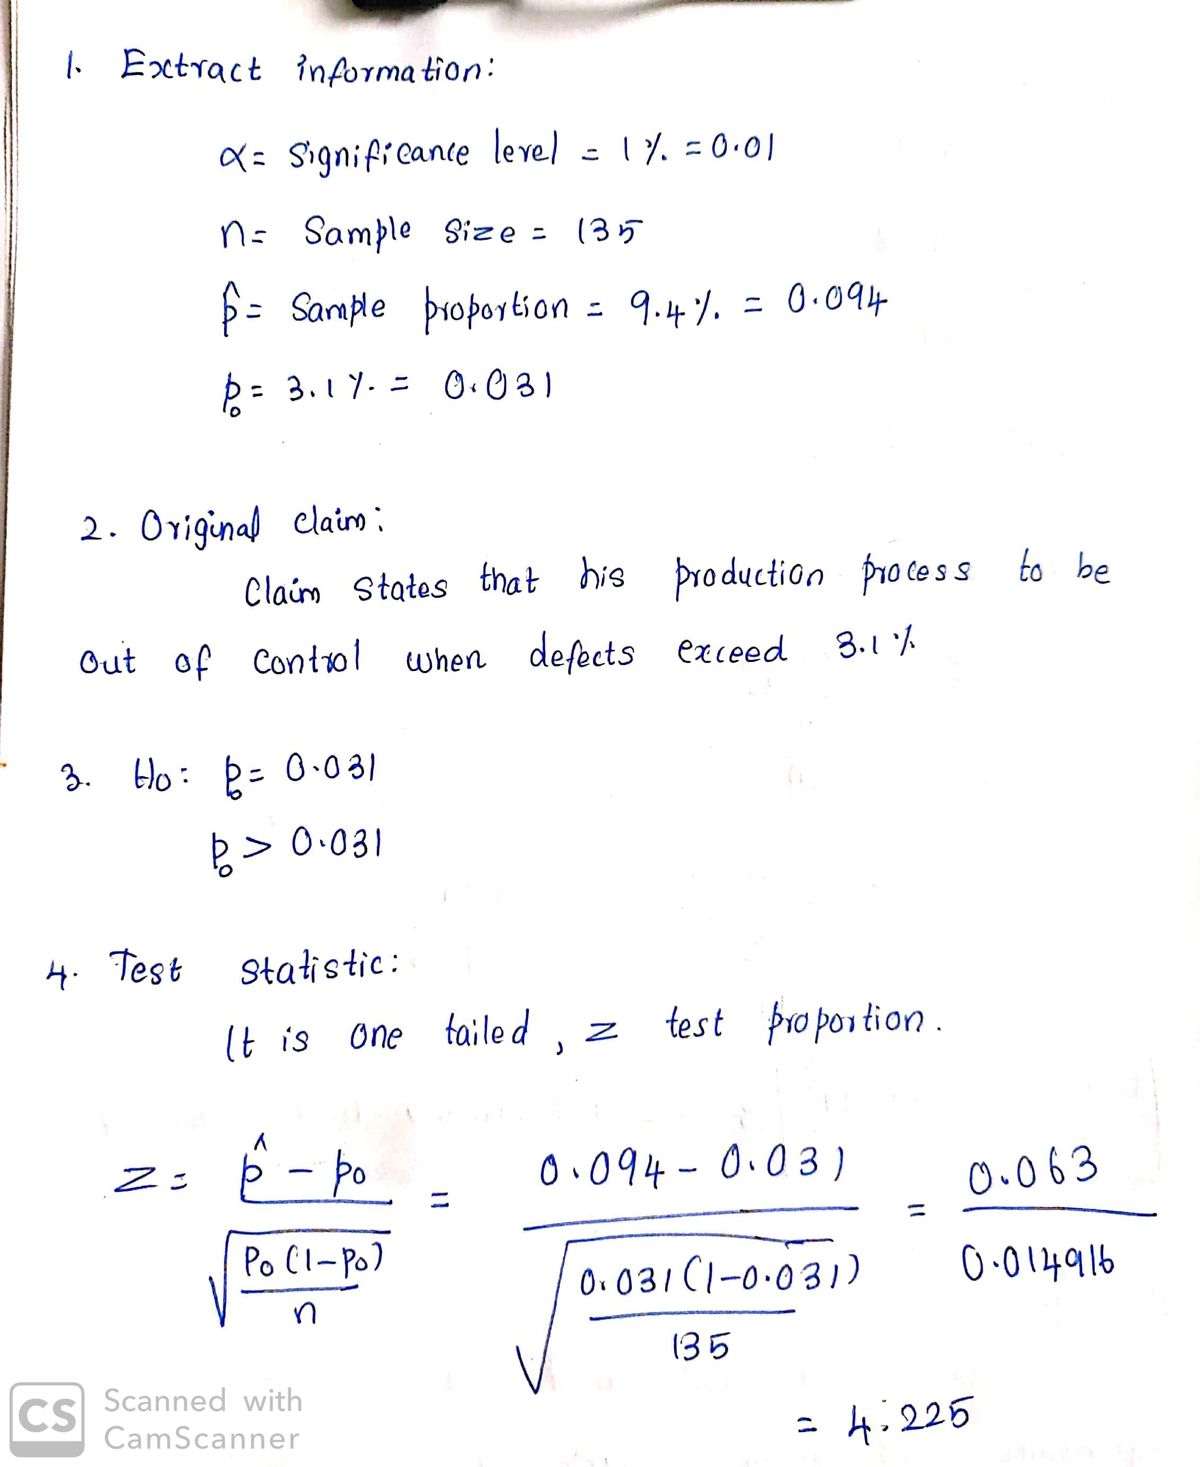
A manufacturer considers his production process to be out of control when defects exceed 3.1%. In a random sampl the defect rate is 9.4% but the manager claims that this is only a sample fluctuation and production is not really out 1% level of significance, use the p-value method to test the manager's claim. Enter the p-value. (Round your answer to nearest thousandth.) When using tables to find a tight range for the p-valu the boundaries of the interval (not 0 or 1) found using the tables. 1. Extract Information: 2. Original Claim: 3. Н 4. Test Statistic: 6. p-Value: 5. Distribution (Graphically): 7. Statistical Conclusion: 8. Final Words:
Inverse Normal Distribution
The method used for finding the corresponding z-critical value in a normal distribution using the known probability is said to be an inverse normal distribution. The inverse normal distribution is a continuous probability distribution with a family of two parameters.
Mean, Median, Mode
It is a descriptive summary of a data set. It can be defined by using some of the measures. The central tendencies do not provide information regarding individual data from the dataset. However, they give a summary of the data set. The central tendency or measure of central tendency is a central or typical value for a probability distribution.
Z-Scores
A z-score is a unit of measurement used in statistics to describe the position of a raw score in terms of its distance from the mean, measured with reference to standard deviation from the mean. Z-scores are useful in statistics because they allow comparison between two scores that belong to different normal distributions.

 1.Extract information:
Step by step
Solved in 2 steps with 2 images


