A mail-order computer business has six telephone lines. Let X denote the number of lines in use at a specified time. Suppose the pmf of X is as given in the accompanying 0 1 2 3 4 5 6 P(x) 0.12 0.18 0.20 0.20 0.20 0.06 0.04 Calculate the cdf F(x). 1 2 3 4 5 6 F(x) 0.12 0.30 0.50 0.70 0.90 0.96 1 Graph the cdf F(x). F(X) F(x) 1.0 1.0 0.8 0.8 0.6 0.6- 0.4 0.4 0.2 0.2 0.0 0.0 1 2 3 4 5 6 7 1 2 3 4 5 6 7 F(x) F(x) 1.0- 1.0 0.8 0.8 0.6 0.6 0.4 0.4 0.2 0.2 0.0 0.0
A mail-order computer business has six telephone lines. Let X denote the number of lines in use at a specified time. Suppose the pmf of X is as given in the accompanying 0 1 2 3 4 5 6 P(x) 0.12 0.18 0.20 0.20 0.20 0.06 0.04 Calculate the cdf F(x). 1 2 3 4 5 6 F(x) 0.12 0.30 0.50 0.70 0.90 0.96 1 Graph the cdf F(x). F(X) F(x) 1.0 1.0 0.8 0.8 0.6 0.6- 0.4 0.4 0.2 0.2 0.0 0.0 1 2 3 4 5 6 7 1 2 3 4 5 6 7 F(x) F(x) 1.0- 1.0 0.8 0.8 0.6 0.6 0.4 0.4 0.2 0.2 0.0 0.0

A First Course in Probability (10th Edition)
10th Edition
ISBN:9780134753119
Author:Sheldon Ross
Publisher:Sheldon Ross
Chapter1: Combinatorial Analysis
Section: Chapter Questions
Problem 1.1P: a. How many different 7-place license plates are possible if the first 2 places are for letters and...

Related questions
Question
100%
Morning, I need help with this homework question

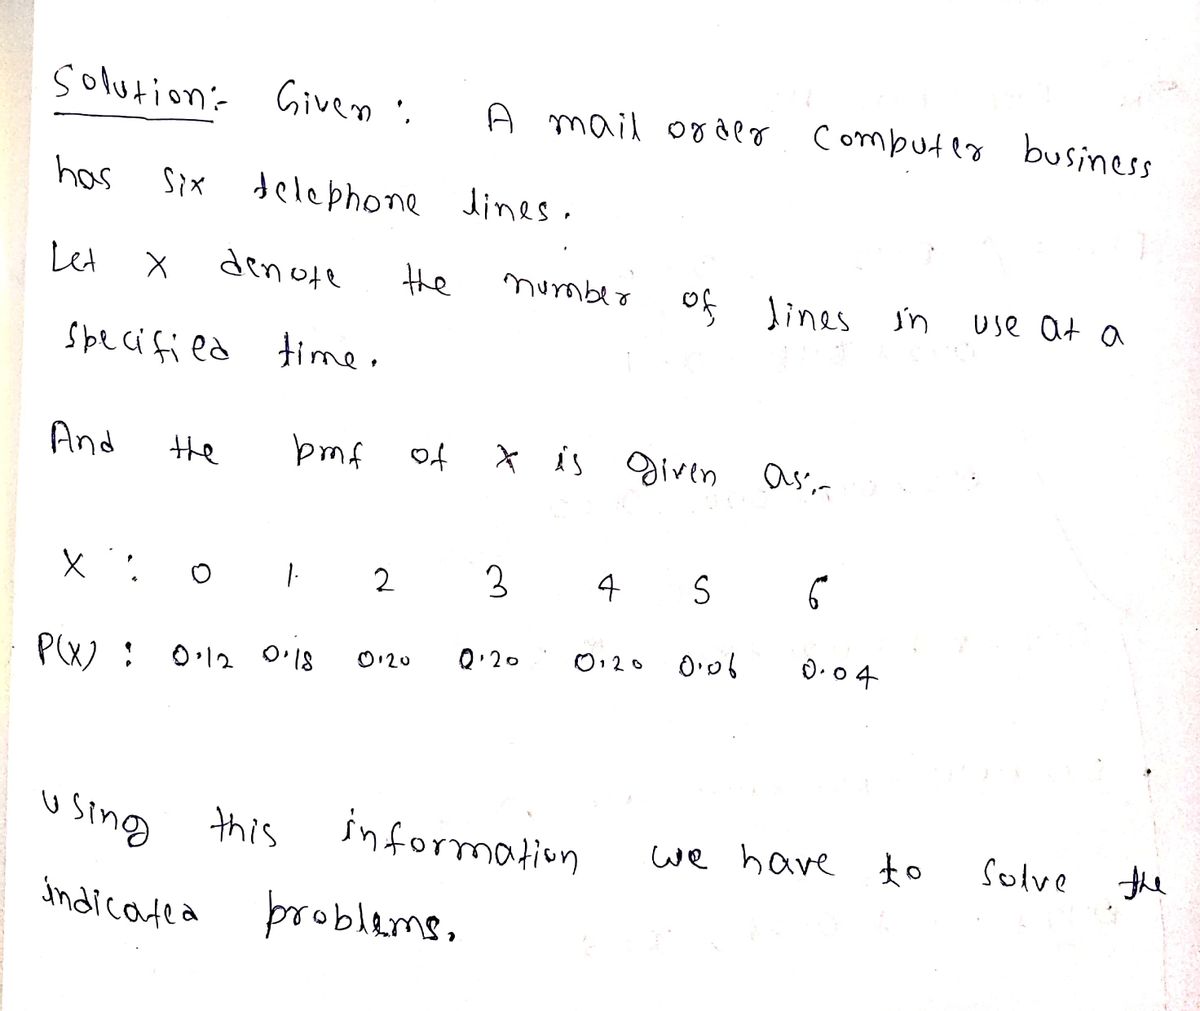
Transcribed Image Text:A mail-order computer business has six telephone lines. Let X denote the number of lines in use at a specified time. Suppose the pmf of X is as given in the accompanying table
0 1
2
3
4
5 6
p(x)
0.12 0.18 0.20 0.20 0.20 0.06 0.04
Calculate the cdf F(x).
1
2
3
4
5
F(x)
0.12
0.30
0.50
0.70
0.90
0.96
1
Graph the cdf F(x).
F(x)
F(x)
1.0
1.0
0.8
0.8
0.6
0.6
0.4
0.4
0.2
0.2
0.0
0.0
X
X
1
4
7
3
7
F(x)
F(x)
1.0
1.0
0.8
0.8
0.6
0.6
0.4
0.4
0.2
0.2
0.0
0.0
X
X

Transcribed Image Text:Use the graph to calculate the probabilities of the events given below.
(a) {at most three lines are in use}
(b) {fewer than three lines are in use}
(c) {at least three lines are in use}
(d) {between two and five lines, inclusive, are in use}
Expert Solution
Step 1

Step by step
Solved in 4 steps with 4 images

Recommended textbooks for you
A First Course in Probability (10th Edition)
Probability
ISBN:
9780134753119
Author:
Sheldon Ross
Publisher:
PEARSON

A First Course in Probability (10th Edition)
Probability
ISBN:
9780134753119
Author:
Sheldon Ross
Publisher:
PEARSON