A laboratory testing campaign has been performed on soil samples within the context of a ground investigation that relates to the construction of a five-story building. The soil strata found in-situ comprises a 6 m layer of fine-grained material overlying permeable bedrock. Ground water table was found to be at the ground surface. Consider that sufficient high quality samples were obtained using block sampling procedures within a trench from a depth of 3 m in order to complete the following tasks. a) A representative soil sample (356.52 g) was subject to a wet sieving test producing the following data as reported by a laboratory technician (see Table 1):
A laboratory testing campaign has been performed on soil samples within the context of a ground investigation that relates to the construction of a five-story building. The soil strata found in-situ comprises a 6 m layer of fine-grained material overlying permeable bedrock. Ground water table was found to be at the ground surface. Consider that sufficient high quality samples were obtained using block sampling procedures within a trench from a depth of 3 m in order to complete the following tasks. a) A representative soil sample (356.52 g) was subject to a wet sieving test producing the following data as reported by a laboratory technician (see Table 1):
Chapter2: Loads On Structures
Section: Chapter Questions
Problem 1P
Related questions
Question
100%

Transcribed Image Text:A laboratory testing campaign has been performed on soil samples within the context of a ground
investigation that relates to the construction of a five-story building. The soil strata found in-situ
comprises a 6 m layer of fine-grained material overlying permeable bedrock. Ground water table
was found to be at the ground surface.
Consider that sufficient high quality samples were obtained using block sampling procedures
within a trench from a depth of 3 m in order to complete the following tasks.
a) A representative soil sample (356.52 g) was subject to a wet sieving test producing the
following data as reported by a laboratory technician (see Table 1):
Table 1. Wet sieving test results
Sieve
size
(mm)
0.552
0.399
0.304
0.209
0.090
0.063
0.047
0.037
0.030
0.022
0.010
0.006
0.004
0.003
0.002
0.001
Mass
retained
(g)
0.000
9.983
16.400
29.235
57.043
34.582
33.156
15.330
20.678
22.461
44.208
19.609
12.478
11.052
15.330
14.974

Transcribed Image Text:Plot the particle size distribution by using semi-logarithmic axes, determine the value of
the mean diameter (d50), the coefficient of uniformity (cu) and the coefficient of curvature
(cc), and then classify the soil and comment on the key expected geotechnical properties
and behaviour of such a soil.
Expert Solution
This question has been solved!
Explore an expertly crafted, step-by-step solution for a thorough understanding of key concepts.
Step 1: Introduce the problem statement
VIEWStep 2: Determine Percent Finer for sieve sizes
VIEWStep 3: Plot the particle Size Distribution Curve
VIEWStep 4: Determine Value of Mean Diameter
VIEWStep 5: Compute Uniformity Coefficient and Coefficient of Curvature
VIEWStep 6: Classify the given soil and comment about it
VIEWSolution
VIEWStep by step
Solved in 7 steps with 14 images

Follow-up Questions
Read through expert solutions to related follow-up questions below.
Follow-up Question

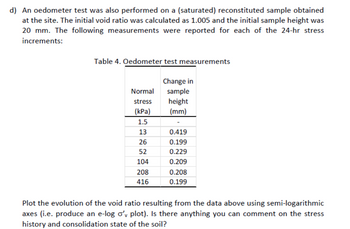
Transcribed Image Text:d) An oedometer test was also performed on a (saturated) reconstituted sample obtained
at the site. The initial void ratio was calculated as 1.005 and the initial sample height was
20 mm. The following measurements were reported for each of the 24-hr stress
increments:
Table 4. Oedometer test measurements
Normal
stress
(kPa)
1.5
13
26
52
104
208
416
Change in
sample
height
(mm)
0.419
0.199
0.229
0.209
0.208
0.199
Plot the evolution of the void ratio resulting from the data above using semi-logarithmic
axes (i.e. produce an e-log o'y plot). Is there anything you can comment on the stress
history and consolidation state of the soil?
Solution
Follow-up Question
c. Recall that the natural moisture of the soil is 36.4%. Consider that the following properties
were also measured using the relevant experimental procedures on representative
(saturated) samples of the soil deposit at a depth of 3 m:
Specific gravity, Gs = 2.62
Unit weight of water, gw = 9.81 kN/m3
Draw a phase diagram and estimate the void ratio and the bulk density of the soil. What
can you comment in relation to the density of the soils and its expected compressibility?
How would you expect these to vary with depth?
Solution
Follow-up Question

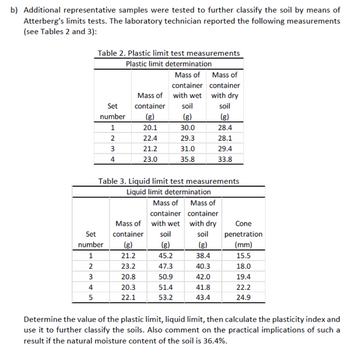
Transcribed Image Text:b) Additional representative samples were tested to further classify the soil by means of
Atterberg's limits tests. The laboratory technician reported the following measurements
(see Tables 2 and 3):
123
2
Table 2. Plastic limit test measurements
Plastic limit determination
Set
number
1
4
5
Set
number
1
2
3
4
Mass of
container
(g)
20.1
22.4
21.2
23.0
Mass of
container
with wet
soil
(g)
30.0
29.3
31.0
35.8
Table 3. Liquid limit test measurements
Liquid limit determination
Mass of Mass of
container
container
with wet
with dry
soil
soil
(g)
(g)
45.2
38.4
47.3
40.3
50.9
42.0
51.4
41.8
53.2
43.4
Mass of
container
(g)
21.2
23.2
20.8
20.3
22.1
Mass of
container
with dry
soil
(g)
28.4
28.1
29.4
33.8
Cone
penetration
(mm)
15.5
18.0
19.4
22.2
24.9
Determine the value of the plastic limit, liquid limit, then calculate the plasticity index and
use it to further classify the soils. Also comment on the practical implications of such a
result if the natural moisture content of the soil is 36.4%.
Solution
Knowledge Booster
Learn more about
Need a deep-dive on the concept behind this application? Look no further. Learn more about this topic, civil-engineering and related others by exploring similar questions and additional content below.Recommended textbooks for you


Structural Analysis (10th Edition)
Civil Engineering
ISBN:
9780134610672
Author:
Russell C. Hibbeler
Publisher:
PEARSON

Principles of Foundation Engineering (MindTap Cou…
Civil Engineering
ISBN:
9781337705028
Author:
Braja M. Das, Nagaratnam Sivakugan
Publisher:
Cengage Learning


Structural Analysis (10th Edition)
Civil Engineering
ISBN:
9780134610672
Author:
Russell C. Hibbeler
Publisher:
PEARSON

Principles of Foundation Engineering (MindTap Cou…
Civil Engineering
ISBN:
9781337705028
Author:
Braja M. Das, Nagaratnam Sivakugan
Publisher:
Cengage Learning

Fundamentals of Structural Analysis
Civil Engineering
ISBN:
9780073398006
Author:
Kenneth M. Leet Emeritus, Chia-Ming Uang, Joel Lanning
Publisher:
McGraw-Hill Education


Traffic and Highway Engineering
Civil Engineering
ISBN:
9781305156241
Author:
Garber, Nicholas J.
Publisher:
Cengage Learning