A group of 2418 students were surveyed about the courses they were taking at their college with the following results: 1205 students said they were taking English. 1204 students said they were taking Psychology. 1255 students said they were taking Math. 534 students said they were taking English and Psychology. 650 students said they were taking Math and Psychology. 581 students said they were taking Math and English. 260 students said they were taking all three courses. Fill in the following Venn Diagram with the cardinality of each region.
A group of 2418 students were surveyed about the courses they were taking at their college with the following results: 1205 students said they were taking English. 1204 students said they were taking Psychology. 1255 students said they were taking Math. 534 students said they were taking English and Psychology. 650 students said they were taking Math and Psychology. 581 students said they were taking Math and English. 260 students said they were taking all three courses. Fill in the following Venn Diagram with the cardinality of each region.

MATLAB: An Introduction with Applications
6th Edition
ISBN:9781119256830
Author:Amos Gilat
Publisher:Amos Gilat
Chapter1: Starting With Matlab
Section: Chapter Questions
Problem 1P

Related questions
Question
100%
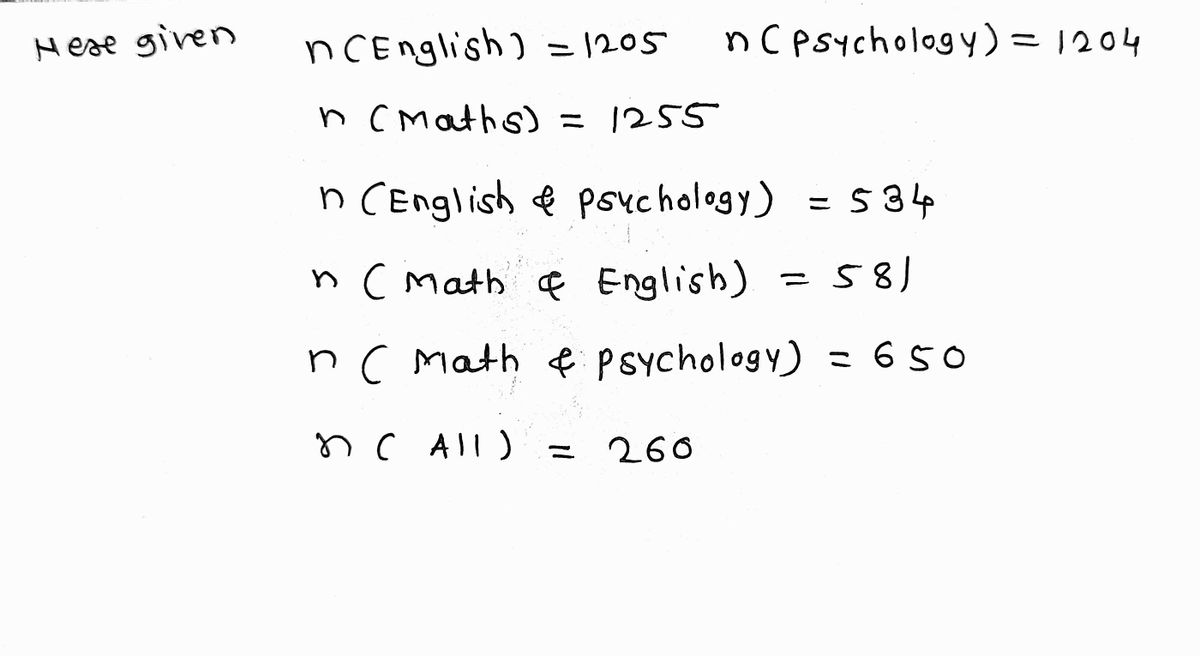
A group of 2418 students were surveyed about the courses they were taking at their college with the following results:
1205 students said they were taking English.
1204 students said they were taking Psychology.
1255 students said they were taking Math.
534 students said they were taking English and Psychology.
650 students said they were taking Math and Psychology.
581 students said they were taking Math and English.
260 students said they were taking all three courses.
Fill in the following Venn Diagram with the cardinality of each region.
I ?
II ?
III ?
IV ?
VI ?
VII ?

Transcribed Image Text:A group of 2418 students were surveyed about the courses they were taking at their college with the
following results:
1205 students said they were taking English.
1204 students said they were taking Psychology.
1255 students said they were taking Math.
534 students said they were taking English and Psychology.
650 students said they were taking Math and Psychology.
581 students said they were taking Math and English.
260 students said they were taking all three courses.
Fill in the following Venn Diagram with the cardinality of each region.
Math
English
II.
I.
III.
V. 260
IV.
VI.
VII.
VIII.
Psychology
Expert Solution
Step 1

Trending now
This is a popular solution!

Step by step
Solved in 2 steps with 2 images

Recommended textbooks for you
MATLAB: An Introduction with Applications
Statistics
ISBN:
9781119256830
Author:
Amos Gilat
Publisher:
John Wiley & Sons Inc

Probability and Statistics for Engineering and th…
Statistics
ISBN:
9781305251809
Author:
Jay L. Devore
Publisher:
Cengage Learning

Statistics for The Behavioral Sciences (MindTap C…
Statistics
ISBN:
9781305504912
Author:
Frederick J Gravetter, Larry B. Wallnau
Publisher:
Cengage Learning
MATLAB: An Introduction with Applications
Statistics
ISBN:
9781119256830
Author:
Amos Gilat
Publisher:
John Wiley & Sons Inc
Probability and Statistics for Engineering and th…
Statistics
ISBN:
9781305251809
Author:
Jay L. Devore
Publisher:
Cengage Learning
Statistics for The Behavioral Sciences (MindTap C…
Statistics
ISBN:
9781305504912
Author:
Frederick J Gravetter, Larry B. Wallnau
Publisher:
Cengage Learning

Elementary Statistics: Picturing the World (7th E…
Statistics
ISBN:
9780134683416
Author:
Ron Larson, Betsy Farber
Publisher:
PEARSON

The Basic Practice of Statistics
Statistics
ISBN:
9781319042578
Author:
David S. Moore, William I. Notz, Michael A. Fligner
Publisher:
W. H. Freeman

Introduction to the Practice of Statistics
Statistics
ISBN:
9781319013387
Author:
David S. Moore, George P. McCabe, Bruce A. Craig
Publisher:
W. H. Freeman