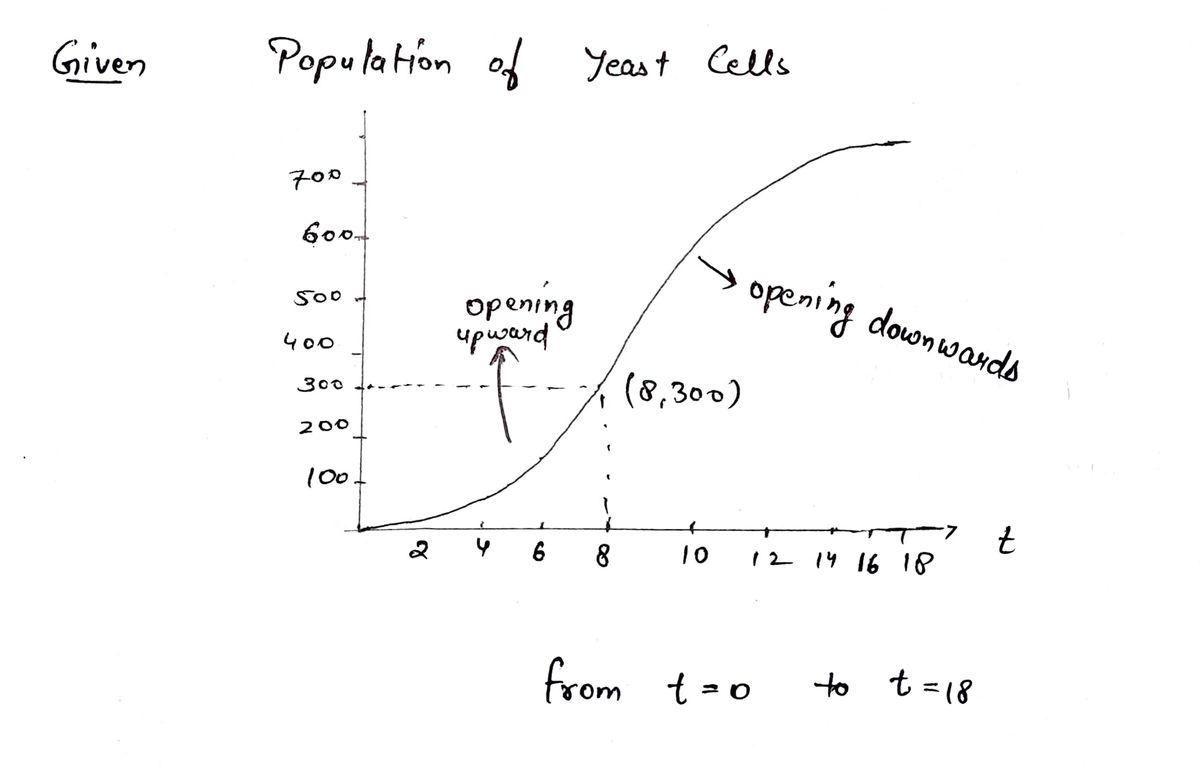
A graph of a population of yeast cells in a new laboratory culture as a function of time from t = 0 to t = 18 is shown. Number of yeast cells y 700 600 500 400 300 200 100 0 0 (t, y) = 2 L 4 6 8 10 12 14 16 18 Time (in hours) (a) Describe how the rate of population increase varies. The rate of increase of the population is initially very large, then gets smaller until it reaches a minimum at about t = 8 hours, and increases toward 0 as the population begins to level off. The rate of increase of the population is initially very small, then gets larger until it reaches a maximum at about t = 18 hours. O The rate of increase of the population is consistently large. O The rate of increase of the population is initially very small, then gets larger until it reaches a maximum at about t = 8 hours, and decreases toward 0 as the population begins to level off. The rate of increase of the population is consistently small. (b) At what point is the rate of population increase the highest? t (c) On what interval(s) is the population function concave upward? (Enter your answer using interval notation.) On what interval(s) is the population function concave downward? (Enter your answer using interval notation.) (d) Estimate the coordinates of the inflection point. (t, y) = (
A graph of a population of yeast cells in a new laboratory culture as a function of time from t = 0 to t = 18 is shown. Number of yeast cells y 700 600 500 400 300 200 100 0 0 (t, y) = 2 L 4 6 8 10 12 14 16 18 Time (in hours) (a) Describe how the rate of population increase varies. The rate of increase of the population is initially very large, then gets smaller until it reaches a minimum at about t = 8 hours, and increases toward 0 as the population begins to level off. The rate of increase of the population is initially very small, then gets larger until it reaches a maximum at about t = 18 hours. O The rate of increase of the population is consistently large. O The rate of increase of the population is initially very small, then gets larger until it reaches a maximum at about t = 8 hours, and decreases toward 0 as the population begins to level off. The rate of increase of the population is consistently small. (b) At what point is the rate of population increase the highest? t (c) On what interval(s) is the population function concave upward? (Enter your answer using interval notation.) On what interval(s) is the population function concave downward? (Enter your answer using interval notation.) (d) Estimate the coordinates of the inflection point. (t, y) = (

Advanced Engineering Mathematics
10th Edition
ISBN:9780470458365
Author:Erwin Kreyszig
Publisher:Erwin Kreyszig
Chapter2: Second-order Linear Odes
Section: Chapter Questions
Problem 1RQ

Related questions
Question

Transcribed Image Text:A graph of a population of yeast cells in a new laboratory culture as a function of time from t = 0 to t = 18 is shown.
Number of
yeast cells
y
700
600
500
400
300
200
100
0
0
(t, y) =
2
4
6
↓
8 10 12 14 16 18
Time (in hours)
(a) Describe how the rate of population increase varies.
O The rate of increase of the population is initially very large, then gets smaller until it reaches a minimum at about
t = 8 hours, and increases toward 0 as the population begins to level off.
O The rate of increase of the population is initially very small, then gets larger until it reaches a maximum at about
t = 18 hours.
The rate of increase of the population is consistently large.
The rate of increase of the population is initially very small, then gets larger until it reaches a maximum at about
t = 8 hours, and decreases toward 0 as the population begins to level off.
The rate of increase of the population is consistently small.
(b) At what point is the rate of population increase the highest?
t
(c) On what interval(s) is the population function concave upward? (Enter your answer using interval notation.)
On what interval(s) is the population function concave downward? (Enter your answer using interval notation.)
(d) Estimate the coordinates of the inflection point.
(t, y) =
Expert Solution
Step 1

Trending now
This is a popular solution!

Step by step
Solved in 2 steps with 2 images

Recommended textbooks for you
Advanced Engineering Mathematics
Advanced Math
ISBN:
9780470458365
Author:
Erwin Kreyszig
Publisher:
Wiley, John & Sons, Incorporated

Numerical Methods for Engineers
Advanced Math
ISBN:
9780073397924
Author:
Steven C. Chapra Dr., Raymond P. Canale
Publisher:
McGraw-Hill Education

Introductory Mathematics for Engineering Applicat…
Advanced Math
ISBN:
9781118141809
Author:
Nathan Klingbeil
Publisher:
WILEY
Advanced Engineering Mathematics
Advanced Math
ISBN:
9780470458365
Author:
Erwin Kreyszig
Publisher:
Wiley, John & Sons, Incorporated
Numerical Methods for Engineers
Advanced Math
ISBN:
9780073397924
Author:
Steven C. Chapra Dr., Raymond P. Canale
Publisher:
McGraw-Hill Education
Introductory Mathematics for Engineering Applicat…
Advanced Math
ISBN:
9781118141809
Author:
Nathan Klingbeil
Publisher:
WILEY

Mathematics For Machine Technology
Advanced Math
ISBN:
9781337798310
Author:
Peterson, John.
Publisher:
Cengage Learning,

