


Contingency Table
A contingency table can be defined as the visual representation of the relationship between two or more categorical variables that can be evaluated and registered. It is a categorical version of the scatterplot, which is used to investigate the linear relationship between two variables. A contingency table is indeed a type of frequency distribution table that displays two variables at the same time.
Binomial Distribution
Binomial is an algebraic expression of the sum or the difference of two terms. Before knowing about binomial distribution, we must know about the binomial theorem.
A fair coin is flipped 6 times. What is the probability that at least two heads are flipped?
Given:
A fair coin is flipped 6 times.
We have to find a probability that at least two heads are flipped.
The probability can be calculated as,
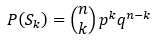
Where
n is the total number of experiments.
k is an expected number of successes.
p is the probability of success and q=1-p.
When a coin is tossed one time then
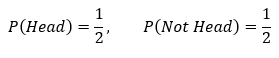
That is,
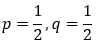
Here, n=6.
Required probability is,


Step by step
Solved in 5 steps with 10 images


