A discrete variable Q, extra inventory units, has integer values from 1 to 10. When sampled 100 times, the following observed probability distribution was obtained: Q 1 2 3 6 9 10 P(Q) 0.2 0.2 0.2 0.1 0.2 0.1 (a) Determine the sample average and standard deviation by hand. (b) Determine the sample average and standard deviation by spreadsheet. (c) Determine the values 1 and 2 standard deviations from the mean. Of the 100 sample points, how many fall within these two ranges?
A discrete variable Q, extra inventory units, has
integer values from 1 to 10. When sampled
100 times, the following observed probability distribution
was obtained:
Q 1 2 3 6 9 10
P(Q) 0.2 0.2 0.2 0.1 0.2 0.1
(a) Determine the sample average and standard
deviation by hand.
(b) Determine the sample average and standard
deviation by spreadsheet.
(c) Determine the values 1 and 2 standard deviations
from the mean. Of the 100 sample
points, how many fall within these two
ranges?
(a) To find the sample average (or expected value – EV) we will multiply the probabilities with the value of the variable.
E(Q) = 1*0.2 + 2*0.2 + 3*0.2 + 6*0.1 + 9*0.2 + 10*0.1
= 4.6
To find the sample standard deviation (SD) we first need to find the Variance (V).
V(Q) = E(Q2) – (E(Q))2
E(Q2) = (1)2*0.2 + (2)2*0.2 + (3)2*0.2 + (6)2*0.1 + (9)2*0.2 + (10)2*0.1
= 32.6
(E(Q))2 = (4.6)2
= 21.16
V(Q) = 32.6 – 21.16
= 11.44
SD(Q) = (11.44)0.5
= 3.38
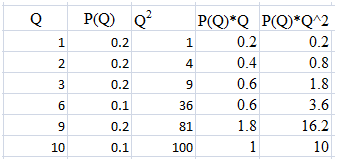
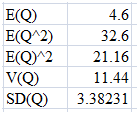
(b) The following table gives us different values that are used to find the EV, V(Q) and SD(Q) by the spreadsheet method.


Step by step
Solved in 3 steps with 4 images


