(a) Determine the area under a normal distribution curve with μ = 55 and o = 7 i. To the right of x = 58 ii. to the right of x = 43
(a) Determine the area under a normal distribution curve with μ = 55 and o = 7 i. To the right of x = 58 ii. to the right of x = 43
MATLAB: An Introduction with Applications
6th Edition
ISBN:9781119256830
Author:Amos Gilat
Publisher:Amos Gilat
Chapter1: Starting With Matlab
Section: Chapter Questions
Problem 1P
Related questions
Question
STEP BY STEP EXPLANATION PLEASE.

Transcribed Image Text:(a) Determine the area under a normal distribution curve with μ = 55 and o = 7
i. To the right of x = 58
ii. to the right of x = 43
(b) A random sample of sixteen (16) SDC workers taken from the management level of the company gives a
mean monthly salary of $17,000 with a standard deviation of $5500.
What is the 98% confidence interval for the population mean of management level employees?
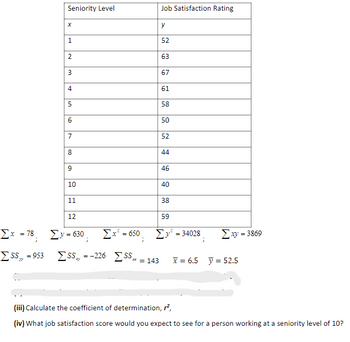
(c) The HR manager at Swift Delivery Company (SDC) has been investigating the level of job satisfaction of
various employees at different levels of the organization. She categorized the jobs into levels of seniority 1
to 12, with 12 being the most senior and 1 being the least senior. The CEO and Board of Directors (levels 13
- 14) were not surveyed. Job satisfaction was rated as a score out of 80. Choosing one person at random
from each of the twelve levels she collected the following data:

Transcribed Image Text:Seniority Level
Σ* =78
ΣSS = 953
X
1
2
3
4
5
6
7
8
9
10
11
12
Job Satisfaction Rating
Σv= 630
y
52
63
67
61
58
50
52
44
46
40
38
Ex = 650
SS=-226 SS = 143
x 6.5
= 52.5
(i) Find the equation of the least squares regression line for the data.
(ii) Calculate the correlation coefficient, r, and interpret the result.
(iii) Calculate the coefficient of determination, ²,
(iv) What job satisfaction score would you expect to see for a person working at a seniority level of 10?
59
Σμ = 34028
;
Σαν = 3869
Expert Solution
This question has been solved!
Explore an expertly crafted, step-by-step solution for a thorough understanding of key concepts.
Step by step
Solved in 3 steps

Follow-up Questions
Read through expert solutions to related follow-up questions below.
Follow-up Question
iii) and iv)

Transcribed Image Text:Σ* =78
ΣSS = 953
Seniority Level
X
1
2
3
4
5
6
7
8
9
10
11
12
Σv= 630
Ex = 650
SS₂ = -226 SS = 143
Job Satisfaction Rating
y
52
63
67
61
58
50
52
44
46
40
38
59
Σμ = 34028
;
Σαν = 3869
x 6.5 = 52.5
(iii) Calculate the coefficient of determination, ²,
(iv) What job satisfaction score would you expect to see for a person working at a seniority level of 10?
Solution
Recommended textbooks for you

MATLAB: An Introduction with Applications
Statistics
ISBN:
9781119256830
Author:
Amos Gilat
Publisher:
John Wiley & Sons Inc

Probability and Statistics for Engineering and th…
Statistics
ISBN:
9781305251809
Author:
Jay L. Devore
Publisher:
Cengage Learning

Statistics for The Behavioral Sciences (MindTap C…
Statistics
ISBN:
9781305504912
Author:
Frederick J Gravetter, Larry B. Wallnau
Publisher:
Cengage Learning

MATLAB: An Introduction with Applications
Statistics
ISBN:
9781119256830
Author:
Amos Gilat
Publisher:
John Wiley & Sons Inc

Probability and Statistics for Engineering and th…
Statistics
ISBN:
9781305251809
Author:
Jay L. Devore
Publisher:
Cengage Learning

Statistics for The Behavioral Sciences (MindTap C…
Statistics
ISBN:
9781305504912
Author:
Frederick J Gravetter, Larry B. Wallnau
Publisher:
Cengage Learning

Elementary Statistics: Picturing the World (7th E…
Statistics
ISBN:
9780134683416
Author:
Ron Larson, Betsy Farber
Publisher:
PEARSON

The Basic Practice of Statistics
Statistics
ISBN:
9781319042578
Author:
David S. Moore, William I. Notz, Michael A. Fligner
Publisher:
W. H. Freeman

Introduction to the Practice of Statistics
Statistics
ISBN:
9781319013387
Author:
David S. Moore, George P. McCabe, Bruce A. Craig
Publisher:
W. H. Freeman