A company's annual revenue after x years is f(x)=x²-9x² +15x +29 thousand dollars (for x 20). (a) Make a sign diagram for the first derivative Select Make a sign diagram for the second derivative. Select (b) Sketch the graph of the revenue function, showing all relative extreme points and inflection points. 35 35 30 25 20 NANA 15 10 6 30 20 Soled 15) 10 (c) Give an interpretation of the infection point. 6 35 20 15) 10 1 2 3 4 The decline in revenue first begins to slow at the inflection point. O The company reaches minimum revenue at the inflection point. O The increase in revenue first begins to slow at the inflection point. O The company reaches maximum revenue at the inflection point. Onone of these 2 4 35 25 20 15) 10) 1 2 4
A company's annual revenue after x years is f(x)=x²-9x² +15x +29 thousand dollars (for x 20). (a) Make a sign diagram for the first derivative Select Make a sign diagram for the second derivative. Select (b) Sketch the graph of the revenue function, showing all relative extreme points and inflection points. 35 35 30 25 20 NANA 15 10 6 30 20 Soled 15) 10 (c) Give an interpretation of the infection point. 6 35 20 15) 10 1 2 3 4 The decline in revenue first begins to slow at the inflection point. O The company reaches minimum revenue at the inflection point. O The increase in revenue first begins to slow at the inflection point. O The company reaches maximum revenue at the inflection point. Onone of these 2 4 35 25 20 15) 10) 1 2 4

College Algebra (MindTap Course List)
12th Edition
ISBN:9781305652231
Author:R. David Gustafson, Jeff Hughes
Publisher:R. David Gustafson, Jeff Hughes
Chapter3: Functions
Section3.3: More On Functions; Piecewise-defined Functions
Problem 84E

Related questions
Question

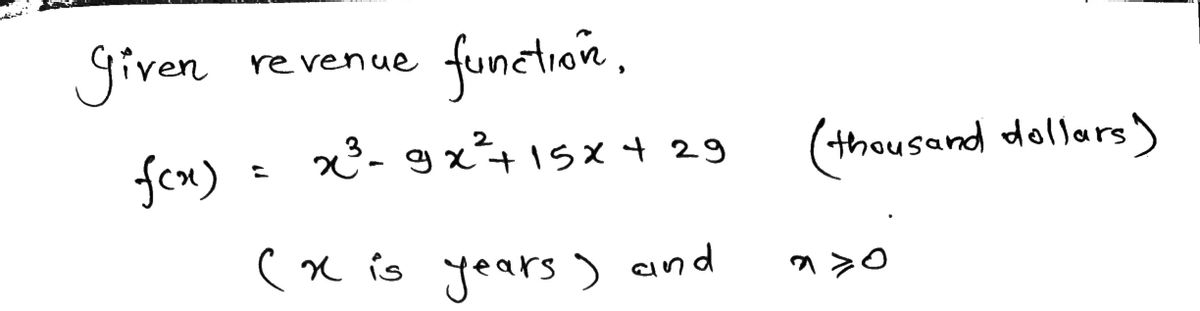
Transcribed Image Text:A company's annual revenue after x years is f(x)=x²-9x² +15x +29 thousand dollars (for x 20).
(a) Make a sign diagram for the first derivative
Select
Make a sign diagram for the second derivative.
Soled
Select
(b) Sketch the graph of the revenue function, showing all relative extreme points and inflection points.
30
35
30
25
20
NANA
15
10
6
35
25
20
15)
10
(c) Give an interpretation of the infection point.
6
35
20
15
10
The decline in revenue first begins to slow at the inflection point.
O The company reaches minimum revenue at the inflection point.
O The increase in revenue first begins to slow at the inflection point.
O The company reaches maximum revenue at the inflection point.
Onone of these
4
2
35
25
20
15)
10
4
Expert Solution
Step 1

Step by step
Solved in 3 steps with 5 images

Recommended textbooks for you
College Algebra (MindTap Course List)
Algebra
ISBN:
9781305652231
Author:
R. David Gustafson, Jeff Hughes
Publisher:
Cengage Learning

College Algebra (MindTap Course List)
Algebra
ISBN:
9781305652231
Author:
R. David Gustafson, Jeff Hughes
Publisher:
Cengage Learning