A company decides to investigate the amount of sick leave taken by its employees. A sample of seven employees yields the following numbers of days of sick leave taken in the past year. 1 1 3 0 0 63 Use this information to answer parts a through c. C... a. Find and interpret the range. The range is 6 days. Choose the correct interpretation of the range below. O A. The largest difference between the mean and any other value is equal to the range. B. The number of days separating the fewest and most sick days taken is equal to the range. C. The range represents the average distance of an observation from the mean. OD. The range gives the most useful value for measuring the spread of the data. b. Find and interpret the standard deviation s. S= (Round to two decimal places as needed.)
A company decides to investigate the amount of sick leave taken by its employees. A sample of seven employees yields the following numbers of days of sick leave taken in the past year. 1 1 3 0 0 63 Use this information to answer parts a through c. C... a. Find and interpret the range. The range is 6 days. Choose the correct interpretation of the range below. O A. The largest difference between the mean and any other value is equal to the range. B. The number of days separating the fewest and most sick days taken is equal to the range. C. The range represents the average distance of an observation from the mean. OD. The range gives the most useful value for measuring the spread of the data. b. Find and interpret the standard deviation s. S= (Round to two decimal places as needed.)
MATLAB: An Introduction with Applications
6th Edition
ISBN:9781119256830
Author:Amos Gilat
Publisher:Amos Gilat
Chapter1: Starting With Matlab
Section: Chapter Questions
Problem 1P
Related questions
Question
1.

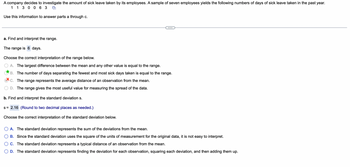
Transcribed Image Text:A company decides to investigate the amount of sick leave taken by its employees. A sample of seven employees yields the following numbers of days of sick leave taken in the past year.
1 1 3 0 0 63 O
Use this information to answer parts a through c.
a. Find and interpret the range.
The range is 6 days.
Choose the correct interpretation of the range below.
A. The largest difference between the mean and any other value is equal to the range.
B. The number of days separating the fewest and most sick days taken is equal to the range.
C. The range represents the average distance of an observation from the mean.
D. The range gives the most useful value for measuring the spread of the data.
b. Find and interpret the standard deviation s.
(Round to two decimal places as needed.)
S=
Expert Solution
This question has been solved!
Explore an expertly crafted, step-by-step solution for a thorough understanding of key concepts.
This is a popular solution!
Trending now
This is a popular solution!
Step by step
Solved in 3 steps

Follow-up Questions
Read through expert solutions to related follow-up questions below.
Follow-up Question

Transcribed Image Text:A company decides to investigate the amount of sick leave taken by its employees. A sample of seven employees yields the following numbers of days of sick leave taken in the past year.
1 1 3 0 0 63
Use this information to answer parts a through c.
O
a. Find and interpret the range.
The range is 6 days.
Choose the correct interpretation of the range below.
A. The largest difference between the mean and any other value is equal to the range.
B. The number of days separating the fewest and most sick days taken is equal to the range.
C. The range represents the average distance of an observation from the mean.
D. The range gives the most useful value for measuring the spread of the data.
b. Find and interpret the standard deviation s.
s= 2.16 (Round to two decimal places as needed.)
Choose the correct interpretation of the standard deviation below.
A. The standard deviation represents the sum of the deviations from the mean.
B. Since the standard deviation uses the square of the units of measurement for the original data, it is not easy to interpret.
C. The standard deviation represents a typical distance of an observation from the mean.
D. The standard deviation represents finding the deviation for each observation, squaring each deviation, and then adding them up.
Solution
Recommended textbooks for you

MATLAB: An Introduction with Applications
Statistics
ISBN:
9781119256830
Author:
Amos Gilat
Publisher:
John Wiley & Sons Inc

Probability and Statistics for Engineering and th…
Statistics
ISBN:
9781305251809
Author:
Jay L. Devore
Publisher:
Cengage Learning

Statistics for The Behavioral Sciences (MindTap C…
Statistics
ISBN:
9781305504912
Author:
Frederick J Gravetter, Larry B. Wallnau
Publisher:
Cengage Learning

MATLAB: An Introduction with Applications
Statistics
ISBN:
9781119256830
Author:
Amos Gilat
Publisher:
John Wiley & Sons Inc

Probability and Statistics for Engineering and th…
Statistics
ISBN:
9781305251809
Author:
Jay L. Devore
Publisher:
Cengage Learning

Statistics for The Behavioral Sciences (MindTap C…
Statistics
ISBN:
9781305504912
Author:
Frederick J Gravetter, Larry B. Wallnau
Publisher:
Cengage Learning

Elementary Statistics: Picturing the World (7th E…
Statistics
ISBN:
9780134683416
Author:
Ron Larson, Betsy Farber
Publisher:
PEARSON

The Basic Practice of Statistics
Statistics
ISBN:
9781319042578
Author:
David S. Moore, William I. Notz, Michael A. Fligner
Publisher:
W. H. Freeman

Introduction to the Practice of Statistics
Statistics
ISBN:
9781319013387
Author:
David S. Moore, George P. McCabe, Bruce A. Craig
Publisher:
W. H. Freeman