A city official claims that the proportion of all commuters who are in favor of an expanded public transportation system is 50%. A newspaper conducts a survey to determine whether this proportion is different from 50%. Out of 225 randomly chosen commuters, the survey finds that 90 of them reply yes when asked if they support an expanded public transportation system. Test the official's claim at a = 0.05.
Contingency Table
A contingency table can be defined as the visual representation of the relationship between two or more categorical variables that can be evaluated and registered. It is a categorical version of the scatterplot, which is used to investigate the linear relationship between two variables. A contingency table is indeed a type of frequency distribution table that displays two variables at the same time.
Binomial Distribution
Binomial is an algebraic expression of the sum or the difference of two terms. Before knowing about binomial distribution, we must know about the binomial theorem.

Objective: To test whether this sample proportion is different from 50% or not.
Setting of Hypothesis:
Null Hypothesis H0 : p = 0.5 that means there is no significance difference between sample proportion and 50%.
Alternative Hypothesis H1 : p ≠ 0.5 that means there is a significance difference between sample proportion and 50%.
Formulae:
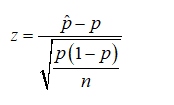
The formula for the one sample proportion test is given as follows below:

where p-hat is sample proportion and it is defined as p-hat = x/n
i.e., x = number of successes
n = number of trails
p is population proportion
Trending now
This is a popular solution!
Step by step
Solved in 2 steps with 2 images


