a-1. Compute the following correlation matrix. (Round your answers to 4 decimal places.) Correlation Matrix Amount of Tip ($) Amount of Bill ($) Diners Amount of Tip ($) Amount of Bill ($) Diners

MATLAB: An Introduction with Applications
6th Edition
ISBN:9781119256830
Author:Amos Gilat
Publisher:Amos Gilat
Chapter1: Starting With Matlab
Section: Chapter Questions
Problem 1P
icon
Related questions
icon
Concept explainers
Question
The Conch Café, located in Gulf Shores, Alabama, features casual lunches with a great view of the Gulf of Mexico. To accommodate
the increase in business during the summer vacation season, Fuzzy Conch, the owner, hires a large number of servers as seasonal
help. When he interviews a prospective server, he would like to provide data on the amount a server can earn in tips. He belleves that
the amount of the bill and the number of diners are both related to the amount of the tip. He gathered the following sample
information.
Amount of
Amount of
Bill
$ 48.97
Number of
Amount of
Amount of
Number of
Diners
Customer
Tip
$7.00
Diners
Customer
Tip
$ 3.30
Bill
$ 23.59
1.
16
4.50
28.23
10.65
19.82
4.
3.50
3.25
17
22.30
32.00
1.00
2.40
5.00
3
1
18
3
19
5.40
50.02
4
5
28.62
2.25
5.50
3.00
20
17.60
6.
4.25
24.83
21
44.47
4
0.50
6.24
22
20.27
19.53
8
6.00
49.20
23
1.25
3.25
6.
5.00
43.26
24
27.03
10
4.75
31.36
25
3.00
21.28
11
5.25
32.87
26
6.25
43.38
12
13
6.00
4.00
34.99
33.91
27
5.60
2.50
9.25
8.25
28.12
4
28
26.25
14
3.35
23.06
29
56.81
15
0.75
4.65
30
50.65
O Click here for the Excel Data File
a-1. Compute the following correlation matrix. (Round your answers to 4 decimal places.)
Correlation Matrix
Amount of Tip ($)
Amount of Bill ($)
Diners
Amount of Tip ($)
Amount of Bill ($)
Diners
< Prev
8 of 10
Next >
Air
Transcribed Image Text:The Conch Café, located in Gulf Shores, Alabama, features casual lunches with a great view of the Gulf of Mexico. To accommodate the increase in business during the summer vacation season, Fuzzy Conch, the owner, hires a large number of servers as seasonal help. When he interviews a prospective server, he would like to provide data on the amount a server can earn in tips. He belleves that the amount of the bill and the number of diners are both related to the amount of the tip. He gathered the following sample information. Amount of Amount of Bill $ 48.97 Number of Amount of Amount of Number of Diners Customer Tip $7.00 Diners Customer Tip $ 3.30 Bill $ 23.59 1. 16 4.50 28.23 10.65 19.82 4. 3.50 3.25 17 22.30 32.00 1.00 2.40 5.00 3 1 18 3 19 5.40 50.02 4 5 28.62 2.25 5.50 3.00 20 17.60 6. 4.25 24.83 21 44.47 4 0.50 6.24 22 20.27 19.53 8 6.00 49.20 23 1.25 3.25 6. 5.00 43.26 24 27.03 10 4.75 31.36 25 3.00 21.28 11 5.25 32.87 26 6.25 43.38 12 13 6.00 4.00 34.99 33.91 27 5.60 2.50 9.25 8.25 28.12 4 28 26.25 14 3.35 23.06 29 56.81 15 0.75 4.65 30 50.65 O Click here for the Excel Data File a-1. Compute the following correlation matrix. (Round your answers to 4 decimal places.) Correlation Matrix Amount of Tip ($) Amount of Bill ($) Diners Amount of Tip ($) Amount of Bill ($) Diners < Prev 8 of 10 Next > Air
Saved
Help
c. Compute and report the regression equation that predicts "amount of bill" with "number of diners." (Negative amounts should be
indicated by a minus sign. Round "amount of bill" to 3 decimal places and "number of diners" to 4 decimal places.)
Amount of Bill
(number of diners)
d-1. Report the regression equation that predicts "amount of tip" with "amount of bill." (Negative amounts should be indicated by a
minus sign. Round your answers to 4 decimal places.)
(amount of bill).
Amount of tip
d-2. Report the coefficient of determination. (Round your answer to 2 decimal places.)
Coefficient of determination
Transcribed Image Text:Saved Help c. Compute and report the regression equation that predicts "amount of bill" with "number of diners." (Negative amounts should be indicated by a minus sign. Round "amount of bill" to 3 decimal places and "number of diners" to 4 decimal places.) Amount of Bill (number of diners) d-1. Report the regression equation that predicts "amount of tip" with "amount of bill." (Negative amounts should be indicated by a minus sign. Round your answers to 4 decimal places.) (amount of bill). Amount of tip d-2. Report the coefficient of determination. (Round your answer to 2 decimal places.) Coefficient of determination
Expert Solution
Step 1

a-1.

The correlation values is obtained using EXCEL. The software procedure is given below:

  • Enter the data.
  • Select Data > Data Analysis >Correlation> OK.
  • Enter Input Range as A1:C31 for variables Amount of tip, Amount of bill and Number of dinners.
  • Mark Labels in First Row.
  • Click OK.

The output using EXCEL is as follows:

Statistics homework question answer, step 1, image 1

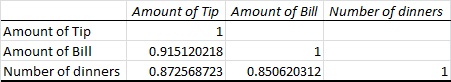
From the output, the correlation matrix is,

  Amount of Tip Amount of Bill Dinners
Amount of tip 1 - -
Amount of Bill 0.9151 1 -
Dinners 0.8726 0.8506 1
trending now

Trending now

This is a popular solution!

steps

Step by step

Solved in 3 steps with 3 images

Blurred answer
Knowledge Booster
Correlation, Regression, and Association
Learn more about
Need a deep-dive on the concept behind this application? Look no further. Learn more about this topic, statistics and related others by exploring similar questions and additional content below.
Similar questions
  • SEE MORE QUESTIONS
Recommended textbooks for you
MATLAB: An Introduction with Applications
Statistics
ISBN:
9781119256830
Author:
Amos Gilat
Publisher:
John Wiley & Sons Inc
Probability and Statistics for Engineering and th…
Statistics
ISBN:
9781305251809
Author:
Jay L. Devore
Publisher:
Cengage Learning
Statistics for The Behavioral Sciences (MindTap C…
Statistics
ISBN:
9781305504912
Author:
Frederick J Gravetter, Larry B. Wallnau
Publisher:
Cengage Learning
Elementary Statistics: Picturing the World (7th E…
Statistics
ISBN:
9780134683416
Author:
Ron Larson, Betsy Farber
Publisher:
PEARSON
The Basic Practice of Statistics
Statistics
ISBN:
9781319042578
Author:
David S. Moore, William I. Notz, Michael A. Fligner
Publisher:
W. H. Freeman
Introduction to the Practice of Statistics
Statistics
ISBN:
9781319013387
Author:
David S. Moore, George P. McCabe, Bruce A. Craig
Publisher:
W. H. Freeman