87 cities were surveyed to determine sports teams. 25 had baseball, 20 had rugby, 16 had basketball, 12 had baseball and rugby, 10 had baseball and basketball, 8 had rugby and basketball. 5 had all three. Let A = baseball, B = rugby, C = basketball. How many had only a baseball team? 8 How many had baseball and rugby, but not basketball? I IV II V VII VI III C B VIII
87 cities were surveyed to determine sports teams. 25 had baseball, 20 had rugby, 16 had basketball, 12 had baseball and rugby, 10 had baseball and basketball, 8 had rugby and basketball. 5 had all three. Let A = baseball, B = rugby, C = basketball. How many had only a baseball team? 8 How many had baseball and rugby, but not basketball? I IV II V VII VI III C B VIII

Advanced Engineering Mathematics
10th Edition
ISBN:9780470458365
Author:Erwin Kreyszig
Publisher:Erwin Kreyszig
Chapter2: Second-order Linear Odes
Section: Chapter Questions
Problem 1RQ

Related questions
Question
![**Survey of Sports Teams in 87 Cities**
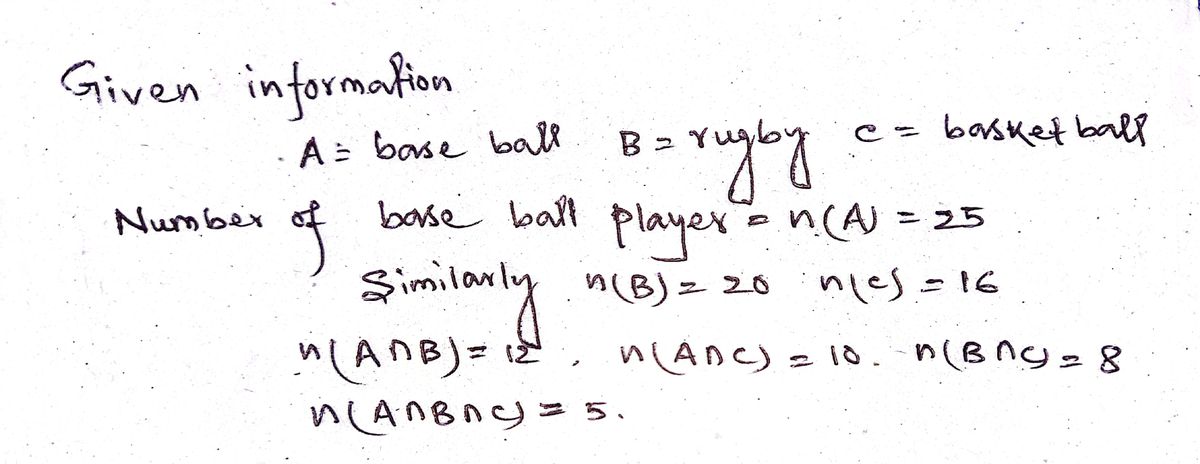
A survey of 87 cities was conducted to determine which sports teams they had. The survey results are as follows:
- 25 cities had baseball teams.
- 20 cities had rugby teams.
- 16 cities had basketball teams.
- 12 cities had both baseball and rugby teams.
- 10 cities had both baseball and basketball teams.
- 8 cities had both rugby and basketball teams.
- 5 cities had teams for all three sports.
**Venn Diagram Representation**
The Venn diagram illustrates the data:
- Circle A represents cities with baseball teams.
- Circle B represents cities with rugby teams.
- Circle C represents cities with basketball teams.
- Region I represents cities that have only baseball.
- Region II represents cities that have both baseball and rugby, but not basketball.
- Region III represents cities that have both rugby and baseball, but not basketball.
- Region IV represents cities that have both baseball and basketball, but not rugby.
- Region V represents cities that have teams for all three sports.
- Region VI represents cities that have both rugby and basketball, but not baseball.
- Region VII represents cities that have only basketball.
- Region VIII represents cities that have none of the three sports.
**Questions**
1. Let A = baseball, B = rugby, C = basketball.
- How many cities had only a baseball team?
\[ \text{Answer:} 8 \]
- How many cities had baseball and rugby, but not basketball?
\[ \text{Answer:} \] (fill in the appropriate number based on further calculations)](/v2/_next/image?url=https%3A%2F%2Fcontent.bartleby.com%2Fqna-images%2Fquestion%2Fb76a34ef-22d3-4cb0-8af6-813d524e1e4e%2F04ee77f2-7e53-4388-9967-90b3ba48ff7a%2F7cy9cak_processed.jpeg&w=3840&q=75)
Transcribed Image Text:**Survey of Sports Teams in 87 Cities**
A survey of 87 cities was conducted to determine which sports teams they had. The survey results are as follows:
- 25 cities had baseball teams.
- 20 cities had rugby teams.
- 16 cities had basketball teams.
- 12 cities had both baseball and rugby teams.
- 10 cities had both baseball and basketball teams.
- 8 cities had both rugby and basketball teams.
- 5 cities had teams for all three sports.
**Venn Diagram Representation**
The Venn diagram illustrates the data:
- Circle A represents cities with baseball teams.
- Circle B represents cities with rugby teams.
- Circle C represents cities with basketball teams.
- Region I represents cities that have only baseball.
- Region II represents cities that have both baseball and rugby, but not basketball.
- Region III represents cities that have both rugby and baseball, but not basketball.
- Region IV represents cities that have both baseball and basketball, but not rugby.
- Region V represents cities that have teams for all three sports.
- Region VI represents cities that have both rugby and basketball, but not baseball.
- Region VII represents cities that have only basketball.
- Region VIII represents cities that have none of the three sports.
**Questions**
1. Let A = baseball, B = rugby, C = basketball.
- How many cities had only a baseball team?
\[ \text{Answer:} 8 \]
- How many cities had baseball and rugby, but not basketball?
\[ \text{Answer:} \] (fill in the appropriate number based on further calculations)

Transcribed Image Text:Shade the Venn Diagram for the set \((B \cap C') \cup A\)
---
Use the graphing tool to shade the regions.
**Instructions:**
- Click the button to enlarge the graph and apply the required shading.
**Diagram Description:**
- The Venn diagram consists of three intersecting circles labeled \(A\), \(B\), and \(C\) within a rectangular space.
- The task is to use set operations to determine which regions within the circles should be shaded according to the expression \((B \cap C') \cup A\).
- \((B \cap C')\) represents the area within circle \(B\) excluding the part that overlaps with circle \(C\).
- The entire circle \(A\) should be shaded because of the union operation \(\cup\) with \(B \cap C'\).
Expert Solution
Step 1

Step by step
Solved in 3 steps with 3 images

Recommended textbooks for you
Advanced Engineering Mathematics
Advanced Math
ISBN:
9780470458365
Author:
Erwin Kreyszig
Publisher:
Wiley, John & Sons, Incorporated

Numerical Methods for Engineers
Advanced Math
ISBN:
9780073397924
Author:
Steven C. Chapra Dr., Raymond P. Canale
Publisher:
McGraw-Hill Education

Introductory Mathematics for Engineering Applicat…
Advanced Math
ISBN:
9781118141809
Author:
Nathan Klingbeil
Publisher:
WILEY
Advanced Engineering Mathematics
Advanced Math
ISBN:
9780470458365
Author:
Erwin Kreyszig
Publisher:
Wiley, John & Sons, Incorporated
Numerical Methods for Engineers
Advanced Math
ISBN:
9780073397924
Author:
Steven C. Chapra Dr., Raymond P. Canale
Publisher:
McGraw-Hill Education
Introductory Mathematics for Engineering Applicat…
Advanced Math
ISBN:
9781118141809
Author:
Nathan Klingbeil
Publisher:
WILEY

Mathematics For Machine Technology
Advanced Math
ISBN:
9781337798310
Author:
Peterson, John.
Publisher:
Cengage Learning,

