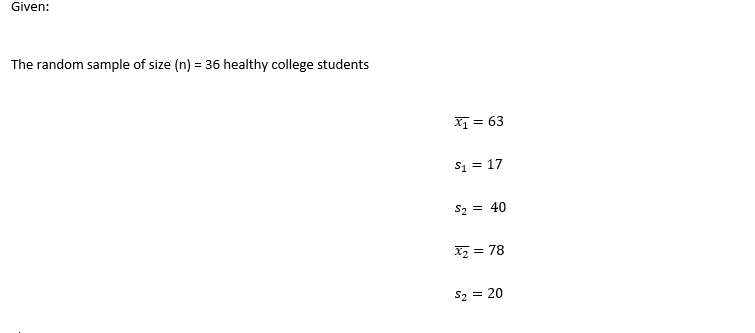
8. In a study, a random sample of 36 healthy college students deprived of one night's sleep received an array of tests inteneded to measure their thinking time, flucency, and flexibility. The overal test scores of those 36 students had a mean of = 63 and a standard deviation of s 17. A random sample of 40 of students who received sleep prior to taking the test 78 with a standard deviation of s2 == 20. had a mean score of 72 (a) Compute a 95% confidelsce interval for the difference in mean test scores p 2. (b) Interpret the confidence interval in the context of the problem. Does it apprear that students depreived of sleep perform worse on the tests than those students who received sleep prior to taking the tests? Explain.

MATLAB: An Introduction with Applications
6th Edition
ISBN:9781119256830
Author:Amos Gilat
Publisher:Amos Gilat
Chapter1: Starting With Matlab
Section: Chapter Questions
Problem 1P
icon
Related questions
Topic Video
Question

Can u please answer all parts to number 8 quickly

unication v
Assessment v
Grades Classlist v
Course Admin Help
> Final Exam
Females: n2
14, 72 = 36, s2 = 7.5
Assuming equal variances, conduct a hypothesis test to examine whether the perception of
the quality of service at 5-star hotels in that country defered by gender. Use a = 0.01.
8. In a study, a random sample of 36 healthy college students deprived of one night's sleep
TEceived an array of tests inteneded to measure their thinking time, flucency, and flexibility.
The overal test scores of those 36 students had a mean of 7= 63 and a standard deviation
of s = 17. A random sample of 40 of students who received sleep prior to taking the test
78 with a standard deviation of s2 = 20.
had a mean score of r2
(a) Compute a 95% confidesce interval for the difference in mean test scores µj – µ2-
(b) Interpret the confidence interval in the context of the problem. Does it apprear that
students depreived of sleep perform worse on the tests than those students who received
sleep prior to taking the tests? Explain.
9. A random sample of 20 new synthetic fishing lines from a company is found to have a mean
breaking strenoth of 7.6 kilogramsThe company claims that the new fishine line has a mean
O Settings
Final Exarm- Fall 20...
quiz 10- Word (Pro...
Transcribed Image Text:unication v Assessment v Grades Classlist v Course Admin Help > Final Exam Females: n2 14, 72 = 36, s2 = 7.5 Assuming equal variances, conduct a hypothesis test to examine whether the perception of the quality of service at 5-star hotels in that country defered by gender. Use a = 0.01. 8. In a study, a random sample of 36 healthy college students deprived of one night's sleep TEceived an array of tests inteneded to measure their thinking time, flucency, and flexibility. The overal test scores of those 36 students had a mean of 7= 63 and a standard deviation of s = 17. A random sample of 40 of students who received sleep prior to taking the test 78 with a standard deviation of s2 = 20. had a mean score of r2 (a) Compute a 95% confidesce interval for the difference in mean test scores µj – µ2- (b) Interpret the confidence interval in the context of the problem. Does it apprear that students depreived of sleep perform worse on the tests than those students who received sleep prior to taking the tests? Explain. 9. A random sample of 20 new synthetic fishing lines from a company is found to have a mean breaking strenoth of 7.6 kilogramsThe company claims that the new fishine line has a mean O Settings Final Exarm- Fall 20... quiz 10- Word (Pro...
Expert Solution
Step 1 Given

Statistics homework question answer, step 1, image 1

steps

Step by step

Solved in 2 steps with 2 images

Blurred answer
Knowledge Booster
Permutation and Combination
Learn more about
Need a deep-dive on the concept behind this application? Look no further. Learn more about this topic, statistics and related others by exploring similar questions and additional content below.
Recommended textbooks for you
MATLAB: An Introduction with Applications
Statistics
ISBN:
9781119256830
Author:
Amos Gilat
Publisher:
John Wiley & Sons Inc
Probability and Statistics for Engineering and th…
Statistics
ISBN:
9781305251809
Author:
Jay L. Devore
Publisher:
Cengage Learning
Statistics for The Behavioral Sciences (MindTap C…
Statistics
ISBN:
9781305504912
Author:
Frederick J Gravetter, Larry B. Wallnau
Publisher:
Cengage Learning
Elementary Statistics: Picturing the World (7th E…
Statistics
ISBN:
9780134683416
Author:
Ron Larson, Betsy Farber
Publisher:
PEARSON
The Basic Practice of Statistics
Statistics
ISBN:
9781319042578
Author:
David S. Moore, William I. Notz, Michael A. Fligner
Publisher:
W. H. Freeman
Introduction to the Practice of Statistics
Statistics
ISBN:
9781319013387
Author:
David S. Moore, George P. McCabe, Bruce A. Craig
Publisher:
W. H. Freeman