7. Verify the following table as a probability distribution. Draw the graph. Find the mean, variance. standard deviation of the shown distribution 2 4 8 P(x) 0.52 0.12 0.28 0.08

Conditions for discrete probability distribution:
The following requirements should be satisfied for the distribution to follow discrete probability distribution.
- The given random variable (X) must take up finite or countable values and it should have its corresponding probabilities.
- The sum of all probabilities must be equal to 1. That is, ∑P(X)=1.
- The probability values must lie between 0 and 1, inclusive. That is, 0≤ P(X)≤1.
Here, the random variable X takes values, 2, 4,6 and 8. Hence the first condition is satisfied.
Consider, ∑P(X)=1. Now, ∑P(X)= 0.52+0.12+0.28+0.08 =1. Hence the second condition is satisfied.
Also, all probability values lie between 0 and 1. Thus, the third condition is satisfied.
Thus, the table represents a probability distribution.
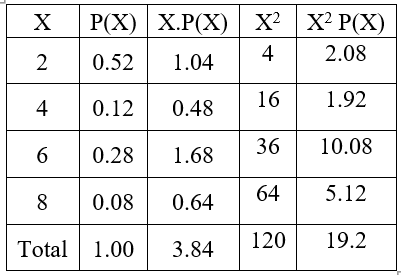
The required calculations for obtaining mean, variance and standard deviation are made in the following table:

The expected value is calculated as follows:
μ=XP(X)
= 3.84
The mean is 3.84.
The variance is calculated as follows:
Variance=∑X2P(X)-E(X)2
=19.2-(3.84)2
=4.4544
Thus, the variance is 4.4544.
Standard deviation = variance = 4.4544 = 2.11.
The standard deviation is 2.11.
Trending now
This is a popular solution!
Step by step
Solved in 3 steps with 2 images


