7. The average salary of North Carolina is reported to be $50,781. After completing a survey of 120 North Carolinians, you find that the sample shows a mean of $51,203 with a standard deviation of $2,409. With a significance level of 0.01, conduct a hypothesis test to test the claim that the average salary of all North Carolinians is greater than $50,781. (Be sure to show all steps of the hypothesis test)
7. The average salary of North Carolina is reported to be $50,781. After completing a survey of 120 North Carolinians, you find that the sample shows a mean of $51,203 with a standard deviation of $2,409. With a significance level of 0.01, conduct a hypothesis test to test the claim that the average salary of all North Carolinians is greater than $50,781. (Be sure to show all steps of the hypothesis test)

MATLAB: An Introduction with Applications
6th Edition
ISBN:9781119256830
Author:Amos Gilat
Publisher:Amos Gilat
Chapter1: Starting With Matlab
Section: Chapter Questions
Problem 1P

Related questions
Question
I need help answering number 7

Transcribed Image Text:**Educational Content Transcription**
---
**B. Discussion Question:**
Do you think Holocaust education should be required in North Carolina middle and high schools? Why or why not?
---
**7. Hypothesis Testing Problem:**
The average salary of North Carolina is reported to be $50,781. After completing a survey of 120 North Carolinians, you find that the sample shows a mean of $51,203 with a standard deviation of $2,409. With a significance level of 0.01, conduct a hypothesis test to test the claim that the average salary of all North Carolinians is greater than $50,781. (Be sure to show all steps of the hypothesis test.)
---
**8. Experiment on Time Spent Playing Sports:**
The average amount of time boys and girls ages 7 through 11 spend playing sports each day is believed to be the same. An experiment is done, data is collected, resulting in the data below:
**Table/Graph:**
- **Sample size**: Average Number of Hours Playing Sports Per Day
(Note: This table or graph section refers to a dataset that is not fully visible in the image.)
---
Expert Solution
Step 1
Solution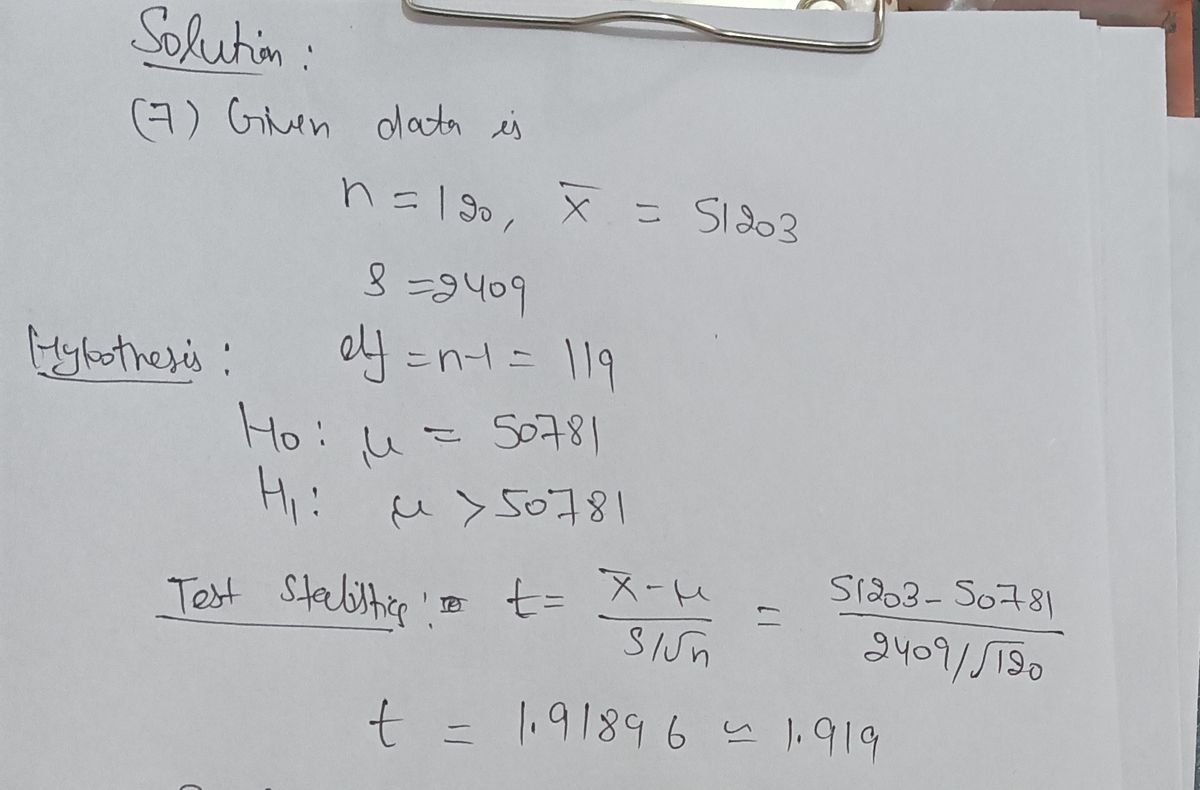

Step by step
Solved in 2 steps with 2 images

Recommended textbooks for you
MATLAB: An Introduction with Applications
Statistics
ISBN:
9781119256830
Author:
Amos Gilat
Publisher:
John Wiley & Sons Inc

Probability and Statistics for Engineering and th…
Statistics
ISBN:
9781305251809
Author:
Jay L. Devore
Publisher:
Cengage Learning

Statistics for The Behavioral Sciences (MindTap C…
Statistics
ISBN:
9781305504912
Author:
Frederick J Gravetter, Larry B. Wallnau
Publisher:
Cengage Learning
MATLAB: An Introduction with Applications
Statistics
ISBN:
9781119256830
Author:
Amos Gilat
Publisher:
John Wiley & Sons Inc
Probability and Statistics for Engineering and th…
Statistics
ISBN:
9781305251809
Author:
Jay L. Devore
Publisher:
Cengage Learning
Statistics for The Behavioral Sciences (MindTap C…
Statistics
ISBN:
9781305504912
Author:
Frederick J Gravetter, Larry B. Wallnau
Publisher:
Cengage Learning

Elementary Statistics: Picturing the World (7th E…
Statistics
ISBN:
9780134683416
Author:
Ron Larson, Betsy Farber
Publisher:
PEARSON

The Basic Practice of Statistics
Statistics
ISBN:
9781319042578
Author:
David S. Moore, William I. Notz, Michael A. Fligner
Publisher:
W. H. Freeman

Introduction to the Practice of Statistics
Statistics
ISBN:
9781319013387
Author:
David S. Moore, George P. McCabe, Bruce A. Craig
Publisher:
W. H. Freeman