5.11 Use the computer to generate 500 samples, each containing n = 25 measurements, from a population that contains values of x equal to 1, 2,..., 48, 49, 50. Assume that these values of x are equally likely. Calculate the sample mean and median m for each sample. Construct relative frequency histograms for the 500 values of and the 500 values of m. Use these approximations to the sampling distributions of and m to answer the following questions: a. Does it appear that I and m are unbiased estimators of the population mean? [Note: μ = 25.5.]
5.11 Use the computer to generate 500 samples, each containing n = 25 measurements, from a population that contains values of x equal to 1, 2,..., 48, 49, 50. Assume that these values of x are equally likely. Calculate the sample mean and median m for each sample. Construct relative frequency histograms for the 500 values of and the 500 values of m. Use these approximations to the sampling distributions of and m to answer the following questions: a. Does it appear that I and m are unbiased estimators of the population mean? [Note: μ = 25.5.]

Glencoe Algebra 1, Student Edition, 9780079039897, 0079039898, 2018
18th Edition
ISBN:9780079039897
Author:Carter
Publisher:Carter
Chapter10: Statistics
Section10.5: Comparing Sets Of Data
Problem 14PPS

Related questions
Question
![5.11 Use the computer to generate 500 samples, each containing
n = 25 measurements, from a population that contains values of x
equal to 1, 2,..., 48, 49, 50. Assume that these values of x are equally
likely. Calculate the sample mean and median m for each sample.
Construct relative frequency histograms for the 500 values of and the
500 values of m. Use these approximations to the sampling
distributions of and m to answer the following questions:
a. Does it appear that I and m are unbiased estimators of the
population mean? [Note: μ = 25.5.]](/v2/_next/image?url=https%3A%2F%2Fcontent.bartleby.com%2Fqna-images%2Fquestion%2Fb1929a2f-f82e-4a25-85fb-a63e31d4f17a%2Fb02ab4e8-d8f3-46d7-a86e-e254250ebe5e%2F929y42n_processed.png&w=3840&q=75)
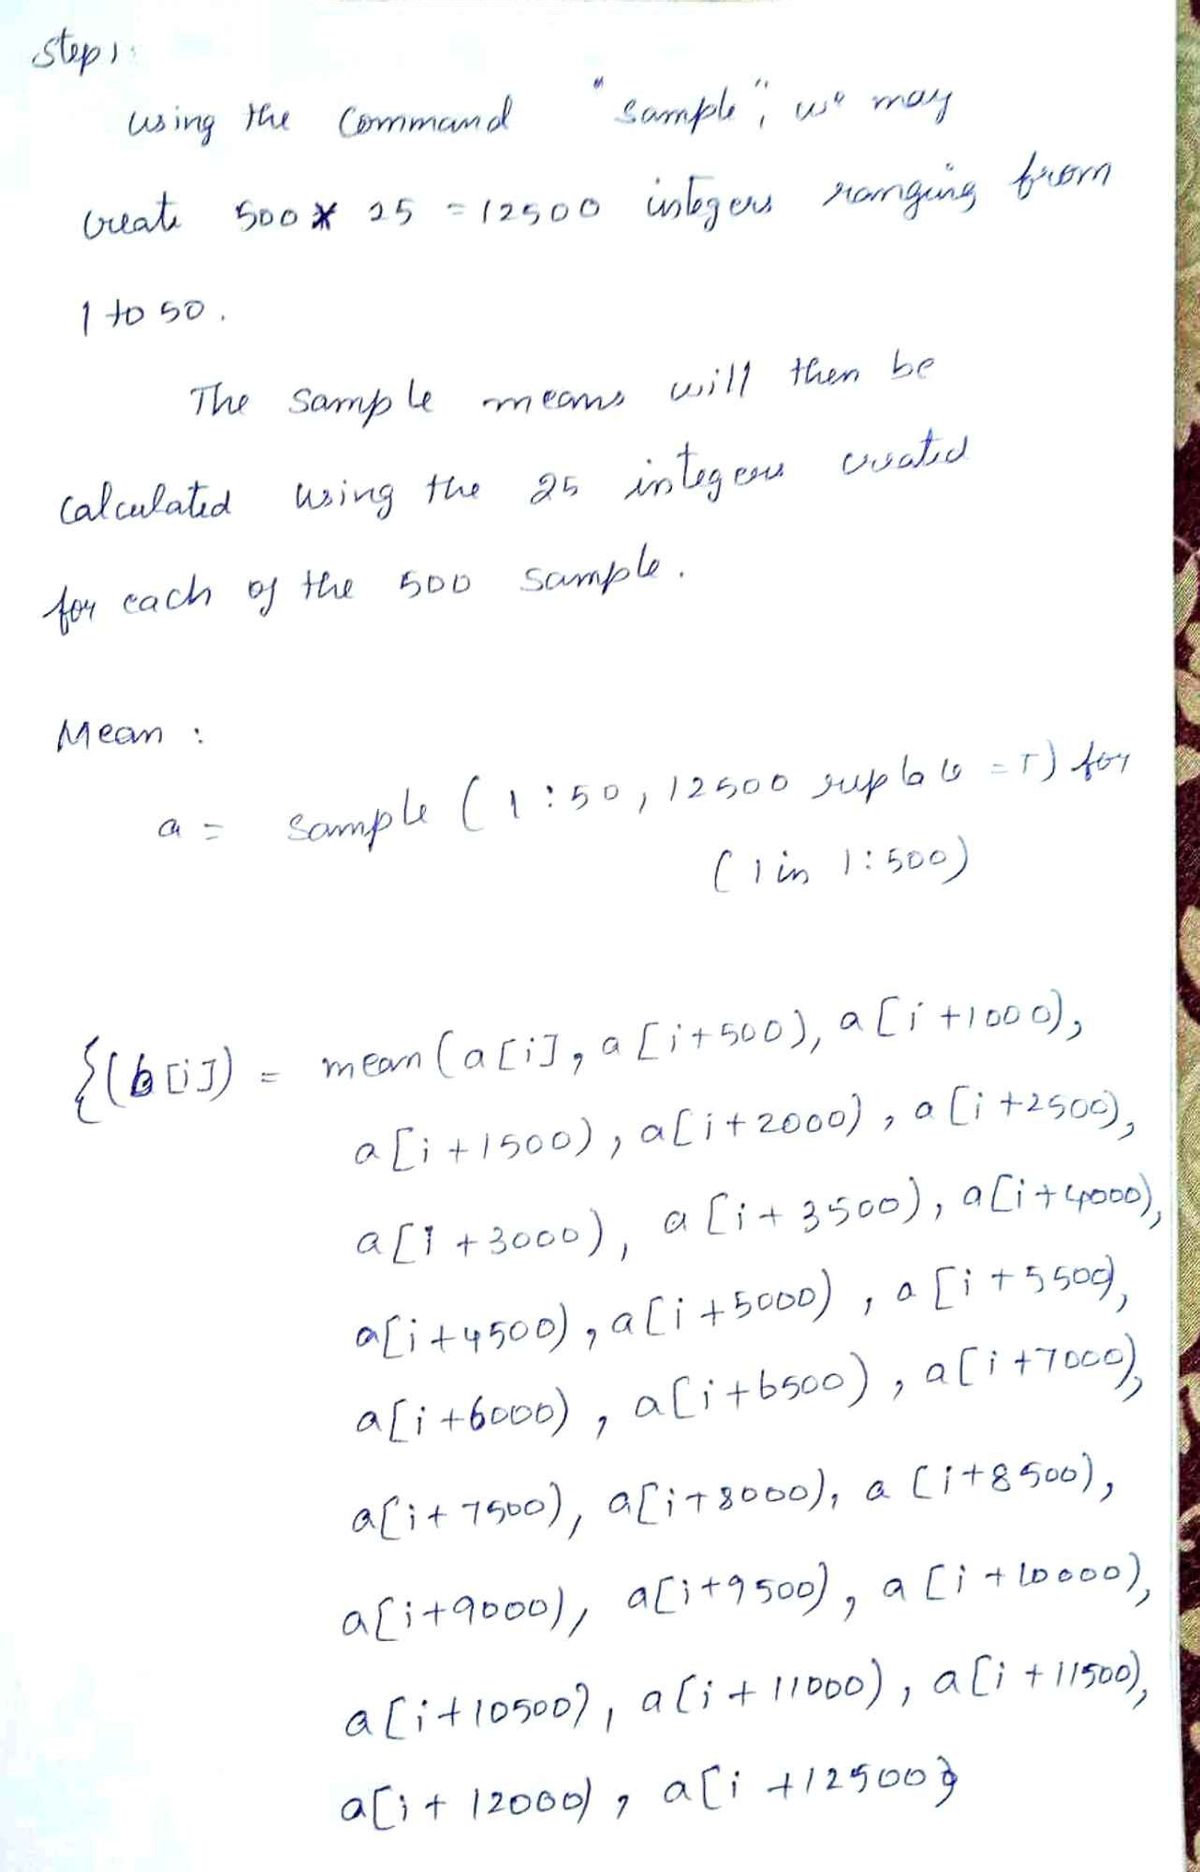
Transcribed Image Text:5.11 Use the computer to generate 500 samples, each containing
n = 25 measurements, from a population that contains values of x
equal to 1, 2,..., 48, 49, 50. Assume that these values of x are equally
likely. Calculate the sample mean and median m for each sample.
Construct relative frequency histograms for the 500 values of and the
500 values of m. Use these approximations to the sampling
distributions of and m to answer the following questions:
a. Does it appear that I and m are unbiased estimators of the
population mean? [Note: μ = 25.5.]
Expert Solution
Step 1

Trending now
This is a popular solution!

Step by step
Solved in 2 steps with 2 images

Recommended textbooks for you
Glencoe Algebra 1, Student Edition, 9780079039897…
Algebra
ISBN:
9780079039897
Author:
Carter
Publisher:
McGraw Hill
Glencoe Algebra 1, Student Edition, 9780079039897…
Algebra
ISBN:
9780079039897
Author:
Carter
Publisher:
McGraw Hill