5. Suppose the system described in question 4 has a string with a lincar density μ-2.95 x 10⁴ kg/m. What is the tension T, in the string for one loops. Show your work.
5. Suppose the system described in question 4 has a string with a lincar density μ-2.95 x 10⁴ kg/m. What is the tension T, in the string for one loops. Show your work.

College Physics
11th Edition
ISBN:9781305952300
Author:Raymond A. Serway, Chris Vuille
Publisher:Raymond A. Serway, Chris Vuille
Chapter1: Units, Trigonometry. And Vectors
Section: Chapter Questions
Problem 1CQ: Estimate the order of magnitude of the length, in meters, of each of the following; (a) a mouse, (b)...

Related questions
Question
100%
Hello, based on page 1 can you do ONLY question number 5 (on page 2)

Transcribed Image Text:Data Table
n
2
3
4
5
6
7
8
μ=
0.00031
fexp
M (g)
kg/m L=
Slope=
260 2
240 9
105 5
65 2
50
9
9
35
= 58.4 H₂
2m
M (kg)
0.260 Ks
0240 kg
Vo-00031 x 0.973
0.105 kg
0.65 kg
10.50 ks
0.35 Kg
cm=
200
m
M 9.81
T, Mg (N) 2 (cm)
2.548
2.352
1.029
6.37
4.90
3.43
Calculation Table
height = 19 x 0.27 = 0.973 /
base
17 x 0.31
√T, (VN)
200.com
1.596
2
133 cm 133 1.533
100 cm
800 cm
Slope=
0.973 /
fexp= 58.4 H₂
λ (m)
222 =2
670 cm
2x2
Page 1
I
1. Using at least 75% of the graph paper, make a graph with 2 on Y axis and √T, on the X axis.
2. Draw a best fit line (a line that doesn't hit any data points but rather goes in between data
points) and calculate the slope by picking two points exactly on the best fit line, do not use
data points to calculate slope. Show your calculation to get credit. Record the slope of the
best fit line in Data Table.
0.8
0.67
570m 0.57
3. According to equation (4), à should be linearly proportional to √Ts with
Equate your value obtained for slope to
this value in Data Table as fexp-
1.014
0.798
0.7
0.585
% Error= 2.67%
as a slope.
1 and solve for the unknown frequency f. Record
S√μ

Transcribed Image Text:4.
Calculate and record the percentage error of fexp compared to the known value (standard) of
the frequency f-60 Hz.
F=IF-F|X100
P
160-58-41 x 100 = 2.67%
60
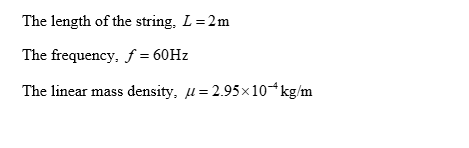
5. Suppose the system described in question 4 has a string with a linear density µ-2.95 x 10⁴
kg/m. What is the tension T, in the string for one loops. Show your work.
↑
Answer all questions:
1. Was the experiment accurate in finding the experimental value for the frequency? State
clearly the basis for your answer.
not accurate, since the experimental value
obtained i has 2.67 % error from the
actual valve
2. Was the experiment of finding the frequency précised? What would your need to answer
this question? Explain your reasoning.
the result is precise because the values
obtained are cumpled around the
Some mean value
Page 2
Expert Solution
Step 1: Given data

Step by step
Solved in 3 steps with 2 images

Knowledge Booster


Learn more about
Need a deep-dive on the concept behind this application? Look no further. Learn more about this topic, physics and related others by exploring similar questions and additional content below.Recommended textbooks for you
College Physics
Physics
ISBN:
9781305952300
Author:
Raymond A. Serway, Chris Vuille
Publisher:
Cengage Learning

University Physics (14th Edition)
Physics
ISBN:
9780133969290
Author:
Hugh D. Young, Roger A. Freedman
Publisher:
PEARSON

Introduction To Quantum Mechanics
Physics
ISBN:
9781107189638
Author:
Griffiths, David J., Schroeter, Darrell F.
Publisher:
Cambridge University Press
College Physics
Physics
ISBN:
9781305952300
Author:
Raymond A. Serway, Chris Vuille
Publisher:
Cengage Learning
University Physics (14th Edition)
Physics
ISBN:
9780133969290
Author:
Hugh D. Young, Roger A. Freedman
Publisher:
PEARSON
Introduction To Quantum Mechanics
Physics
ISBN:
9781107189638
Author:
Griffiths, David J., Schroeter, Darrell F.
Publisher:
Cambridge University Press

Physics for Scientists and Engineers
Physics
ISBN:
9781337553278
Author:
Raymond A. Serway, John W. Jewett
Publisher:
Cengage Learning

Lecture- Tutorials for Introductory Astronomy
Physics
ISBN:
9780321820464
Author:
Edward E. Prather, Tim P. Slater, Jeff P. Adams, Gina Brissenden
Publisher:
Addison-Wesley

College Physics: A Strategic Approach (4th Editio…
Physics
ISBN:
9780134609034
Author:
Randall D. Knight (Professor Emeritus), Brian Jones, Stuart Field
Publisher:
PEARSON