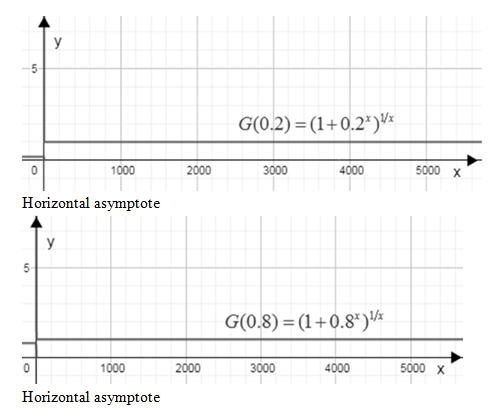
47. Let G(b) = lim (1+b*)/ for b > 0. Investigate G (b) numerically and graphically for b = 0.2, 0.8, 2, 3, 5 (and additional values if necessary). Then make a conjecture for the value of G(b) as a function of b. Draw a graph of y = G(b). Does G appear to be continuous? We will evaluate G(b) using L'Hôpital's Rule in Section 4.5 (see Exercise 69 %3D there).

The objective is to numerically and graphically investigate for the different values of f.
To do this substitute to obtain a function that can be evaluated graphically.
To graphically evaluate the given function obtain the limit as x approaches infinity.
Need to look for horizontal asymptotes, where horizontal asymptotes are horizontal lines that the graph of a function approaches as x tends to infinity.
Numerically, investigate a certain limit by determine the values of the function in a points that are very close to the limit.
A limit at infinity can be calculate the values of the function for every large values of x which is tabulated below to obtain the trend of the given function to see if it approaches any particular value as x gets larger and larger.
List the table that every large values of x.
|
x |
100 |
1000 |
10000 |
|
1 |
1 |
1 |
1 |
|
2 |
2 |
Undefined |
Undefined |
|
3 |
Undefined |
Undefined |
Undefined |
|
5 |
Undefined |
Undefined |
Undefined |
The following graphs show the given function for carious values of b.

Step by step
Solved in 4 steps with 3 images


