42. FILE Car_Price. The accompanying table shows a portion of data consisting of the selling price, the age, and the mile Mileage 61485 54344 1 42408 a. Construct a scatterplot of Price against Age. Describe the relationship. b. Construct a scatterplot of Price against Mileage. Describe the relationship. c. Convert Mileage into a categorical variable, Mileage_Category, by assigning all cars with less than 50,000 miles to and the rest to the "High_Mileage" category. How many cars are in the "High_Mileage" category? d. Construct a scatterplot using Price, Age, and Mileage Category. Use different colors or symbols to show car categories. Describe the relationships between price, age, and mileage of these used sedans. Does the relationsh both mileage categories? Price 13590 13775 I 11988 Age 6 6 I 8
42. FILE Car_Price. The accompanying table shows a portion of data consisting of the selling price, the age, and the mile Mileage 61485 54344 1 42408 a. Construct a scatterplot of Price against Age. Describe the relationship. b. Construct a scatterplot of Price against Mileage. Describe the relationship. c. Convert Mileage into a categorical variable, Mileage_Category, by assigning all cars with less than 50,000 miles to and the rest to the "High_Mileage" category. How many cars are in the "High_Mileage" category? d. Construct a scatterplot using Price, Age, and Mileage Category. Use different colors or symbols to show car categories. Describe the relationships between price, age, and mileage of these used sedans. Does the relationsh both mileage categories? Price 13590 13775 I 11988 Age 6 6 I 8

MATLAB: An Introduction with Applications
6th Edition
ISBN:9781119256830
Author:Amos Gilat
Publisher:Amos Gilat
Chapter1: Starting With Matlab
Section: Chapter Questions
Problem 1P

Related questions
Question

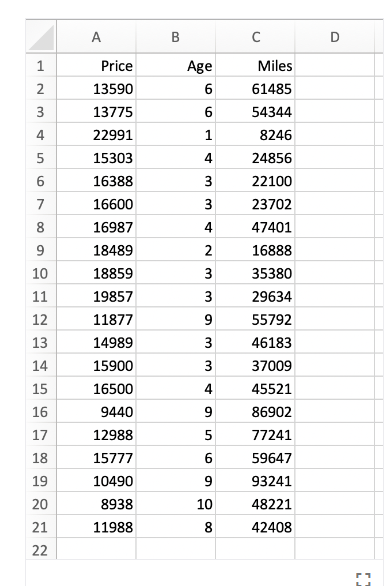
Transcribed Image Text:42. FILE Car_Price. The accompanying table shows a portion of data consisting of the selling price, the age, and the mileage for 20 used sedans.
Mileage
61485
54344
Price
13590
13775
⠀
11988
Age
6
6
⠀
8
42408
a. Construct a scatterplot of Price against Age. Describe the relationship.
b. Construct a scatterplot of Price against Mileage. Describe the relationship.
c. Convert Mileage into a categorical variable, Mileage_Category, by assigning all cars with less than 50,000 miles to the "Low_Mileage" category page 68
and the rest to the "High_Mileage" category. How many cars are in the "High_Mileage" category?
d. Construct a scatterplot using Price, Age, and Mileage Category. Use different colors or symbols to show cars that belong to the different mileage
categories. Describe the relationships between price, age, and mileage of these used sedans. Does the relationship between price and age hold true for
both mileage categories?
:

Transcribed Image Text:1
2
3
4
5
6
7
8
9
10
11
12
13
14
15
16
17
18
19
20
21
22
A
Price
13590
13775
22991
15303
16388
16600
16987
18489
18859
19857
11877
14989
15900
16500
9440
12988
15777
10490
8938
11988
B
Age
6
6
1
4
3
3
4
2
3
3
9
3
3
4
9
5
6
9
10
8
C
Miles
61485
54344
8246
24856
22100
23702
47401
16888
35380
29634
55792
46183
37009
45521
86902
77241
59647
93241
48221
42408
D
Expert Solution
Step 1
NOTE: " Since you have posted the question with multiple-subparts", we are answering first three sub-parts for you. Kindly repost the question and specify the unanswered ones to solve
The given table shows a portion of data consisting of selling price, the age and mileage for 20 used sedans

Trending now
This is a popular solution!

Step by step
Solved in 4 steps with 6 images

Follow-up Questions
Read through expert solutions to related follow-up questions below.
Follow-up Question

Transcribed Image Text:42. FILE Car_Price. The accompanying table shows a portion of data consisting of the selling price, the age, and the mileage for 20 used sedans.
Mileage
61485
54344
Price
13590
13775
⠀
11988
Age
6
6
⠀
8
:
42408
d. Construct a scatterplot using Price, Age, and Mileage_ Category. Use different colors or symbols to show cars that belong to the different mileage
categories. Describe the relationships between price, age, and mileage of these used sedans. Does the relationship between price and age hold true for
both mileage categories?
Solution
Recommended textbooks for you
MATLAB: An Introduction with Applications
Statistics
ISBN:
9781119256830
Author:
Amos Gilat
Publisher:
John Wiley & Sons Inc

Probability and Statistics for Engineering and th…
Statistics
ISBN:
9781305251809
Author:
Jay L. Devore
Publisher:
Cengage Learning

Statistics for The Behavioral Sciences (MindTap C…
Statistics
ISBN:
9781305504912
Author:
Frederick J Gravetter, Larry B. Wallnau
Publisher:
Cengage Learning
MATLAB: An Introduction with Applications
Statistics
ISBN:
9781119256830
Author:
Amos Gilat
Publisher:
John Wiley & Sons Inc
Probability and Statistics for Engineering and th…
Statistics
ISBN:
9781305251809
Author:
Jay L. Devore
Publisher:
Cengage Learning
Statistics for The Behavioral Sciences (MindTap C…
Statistics
ISBN:
9781305504912
Author:
Frederick J Gravetter, Larry B. Wallnau
Publisher:
Cengage Learning

Elementary Statistics: Picturing the World (7th E…
Statistics
ISBN:
9780134683416
Author:
Ron Larson, Betsy Farber
Publisher:
PEARSON

The Basic Practice of Statistics
Statistics
ISBN:
9781319042578
Author:
David S. Moore, William I. Notz, Michael A. Fligner
Publisher:
W. H. Freeman

Introduction to the Practice of Statistics
Statistics
ISBN:
9781319013387
Author:
David S. Moore, George P. McCabe, Bruce A. Craig
Publisher:
W. H. Freeman