Algebra and Trigonometry (6th Edition)
6th Edition
ISBN:9780134463216
Author:Robert F. Blitzer
Publisher:Robert F. Blitzer
ChapterP: Prerequisites: Fundamental Concepts Of Algebra
Section: Chapter Questions
Problem 1MCCP: In Exercises 1-25, simplify the given expression or perform the indicated operation (and simplify,...
Related questions
Question
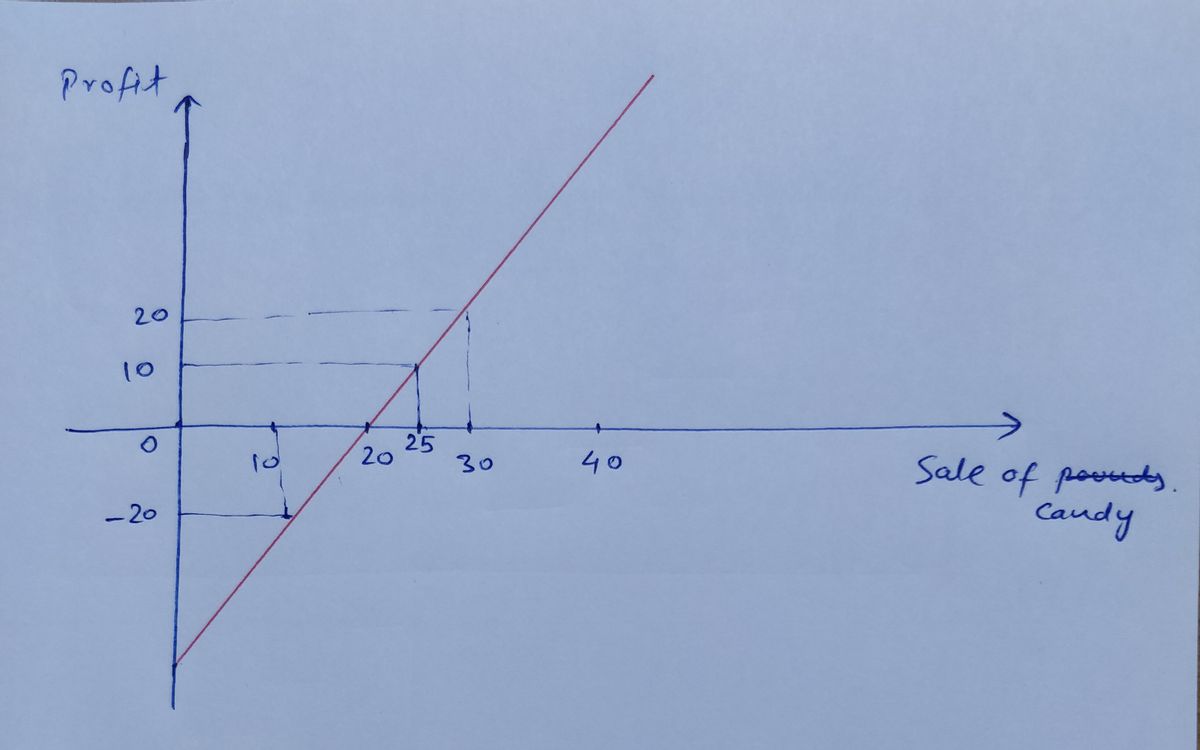
Gordon also decides to sell candy at school by the pound. The graph below displays the amount of money he can earn as a function, G, of how many pounds he sells.
Gordon sell 25 pieces of candy, how much profit will he earn?

Transcribed Image Text:The image depicts a graph on a standard Cartesian coordinate plane with a single linear function labeled "Function G."
**Graph Details:**
- **Axes:** The x-axis and y-axis are both labeled with intervals of 10, ranging from at least -30 to 60 on the y-axis and from 0 to 50 on the x-axis.
- **Line:** The line representing Function G is drawn in green and has a positive slope. It starts below the x-axis at approximately (-10, -30) and extends to above the y-axis, passing through (40, 40).
- **Slope:** The function appears to have an approximate slope of 1, as it rises 10 units vertically for each 10-unit increase horizontally.
- **Quadrants:** The line passes through the origin and remains in the first and third quadrants, indicating it does intersect both axes.
This graph is useful for visualizing linear relationships and understanding the concept of slope and y-intercept in a mathematical context.
Expert Solution
Step 1

Trending now
This is a popular solution!
Step by step
Solved in 2 steps with 2 images

Recommended textbooks for you

Algebra and Trigonometry (6th Edition)
Algebra
ISBN:
9780134463216
Author:
Robert F. Blitzer
Publisher:
PEARSON

Contemporary Abstract Algebra
Algebra
ISBN:
9781305657960
Author:
Joseph Gallian
Publisher:
Cengage Learning

Linear Algebra: A Modern Introduction
Algebra
ISBN:
9781285463247
Author:
David Poole
Publisher:
Cengage Learning

Algebra and Trigonometry (6th Edition)
Algebra
ISBN:
9780134463216
Author:
Robert F. Blitzer
Publisher:
PEARSON

Contemporary Abstract Algebra
Algebra
ISBN:
9781305657960
Author:
Joseph Gallian
Publisher:
Cengage Learning

Linear Algebra: A Modern Introduction
Algebra
ISBN:
9781285463247
Author:
David Poole
Publisher:
Cengage Learning

Algebra And Trigonometry (11th Edition)
Algebra
ISBN:
9780135163078
Author:
Michael Sullivan
Publisher:
PEARSON

Introduction to Linear Algebra, Fifth Edition
Algebra
ISBN:
9780980232776
Author:
Gilbert Strang
Publisher:
Wellesley-Cambridge Press

College Algebra (Collegiate Math)
Algebra
ISBN:
9780077836344
Author:
Julie Miller, Donna Gerken
Publisher:
McGraw-Hill Education