4 Suppose the president has a 60% approval rating among voters. Twelve voters are randomly selected and asked if they approve of the president. The population is so large that, while sampling is not done with replacement, this does little to affect the independence of the trials. We want to know the probability that seven of the 12 voters approve of the president. A Explain why this is a binomial experiment.


Contingency Table
A contingency table can be defined as the visual representation of the relationship between two or more categorical variables that can be evaluated and registered. It is a categorical version of the scatterplot, which is used to investigate the linear relationship between two variables. A contingency table is indeed a type of frequency distribution table that displays two variables at the same time.
Binomial Distribution
Binomial is an algebraic expression of the sum or the difference of two terms. Before knowing about binomial distribution, we must know about the binomial theorem.
Binomial distribution and


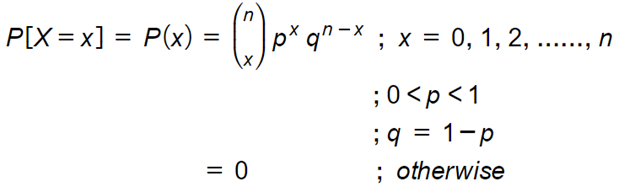
Binomial distribution: A discrete r.v. X taking values 0,1,2,3, …., n is said to follow a binomial distribution with parameters n and p if it's p.m.f is given by,

Trending now
This is a popular solution!

Step by step
Solved in 3 steps with 1 images


