Algebra & Trigonometry with Analytic Geometry
13th Edition
ISBN:9781133382119
Author:Swokowski
Publisher:Swokowski
Chapter4: Polynomial And Rational Functions
Section4.5: Rational Functions
Problem 7E
Related questions
Question
I need help finding a equation that fits this graph.

Transcribed Image Text:The image is a graph depicting the function \( f(x) \) with vertical and horizontal asymptotes, as well as significant points marked on the Cartesian plane. Below is a detailed description:
- **Axes:**
- The horizontal axis is labeled as the \( x \)-axis.
- The vertical axis is labeled as the \( y \)-axis.
- **Asymptotes:**
- A vertical asymptote is drawn as a dashed pink line at \( x = -1 \).
- Another vertical asymptote is drawn as a dashed pink line at \( x = 2 \).
- A horizontal asymptote is placed at \( y = 1 \) with a dashed pink line.
- **Curve:**
- The curve approaches the vertical asymptote at \( x = -1 \) from both sides.
- The curve descends towards the asymptote at \( x = 2 \) and moves away on the other side.
- There is a smooth transition just below the horizontal asymptote \( y = 1 \) as \( x \) increases.
- **Labeled Points:**
- Points along the \( x \)-axis are labeled at intervals: \(-4, -3, -2, 1, 3, 4, 5\).
- Points along the \( y \)-axis are labeled at values: \(-2, -1, 1, 2, 3\).
The overall behavior illustrated is typical of a rational function involving vertical and horizontal asymptotes, showing two branches of the curve that approach the asymptotes yet do not intersect them.
Expert Solution
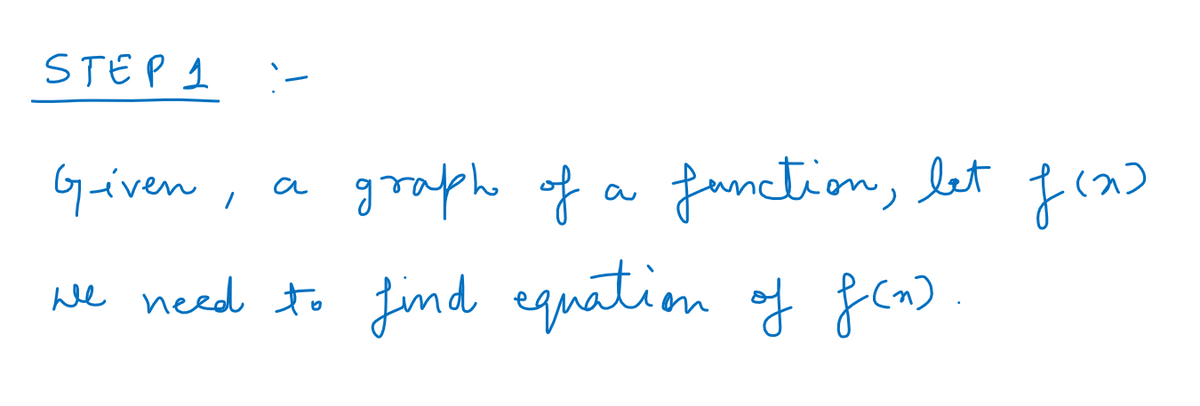
Step 1: Write what is given and what to find

Trending now
This is a popular solution!
Step by step
Solved in 4 steps with 4 images

Recommended textbooks for you

Algebra & Trigonometry with Analytic Geometry
Algebra
ISBN:
9781133382119
Author:
Swokowski
Publisher:
Cengage

College Algebra
Algebra
ISBN:
9781305115545
Author:
James Stewart, Lothar Redlin, Saleem Watson
Publisher:
Cengage Learning

Algebra for College Students
Algebra
ISBN:
9781285195780
Author:
Jerome E. Kaufmann, Karen L. Schwitters
Publisher:
Cengage Learning

Algebra & Trigonometry with Analytic Geometry
Algebra
ISBN:
9781133382119
Author:
Swokowski
Publisher:
Cengage

College Algebra
Algebra
ISBN:
9781305115545
Author:
James Stewart, Lothar Redlin, Saleem Watson
Publisher:
Cengage Learning

Algebra for College Students
Algebra
ISBN:
9781285195780
Author:
Jerome E. Kaufmann, Karen L. Schwitters
Publisher:
Cengage Learning