situation (one each) by which the different inferential statistics can be used. State the corresponding null and alternative hypothesis. 1. t-test of significant difference ●Between sample & population means ●Between independent samples ●Between dependent samples 2. t-test of significant relationship 3. Z-test of significant of ø
situation (one each) by which the different inferential statistics can be used. State the corresponding null and alternative hypothesis. 1. t-test of significant difference ●Between sample & population means ●Between independent samples ●Between dependent samples 2. t-test of significant relationship 3. Z-test of significant of ø
MATLAB: An Introduction with Applications
6th Edition
ISBN:9781119256830
Author:Amos Gilat
Publisher:Amos Gilat
Chapter1: Starting With Matlab
Section: Chapter Questions
Problem 1P
Related questions
Question
Give situation (one each) by which the different
1. t-test of significant difference
●Between sample & population means
●Between independent samples
●Between dependent samples
2. t-test of significant relationship
3. Z-test of significant of ø
4. Z-test of significance of population peoportions
Expert Solution
This question has been solved!
Explore an expertly crafted, step-by-step solution for a thorough understanding of key concepts.
Step by step
Solved in 4 steps

Follow-up Questions
Read through expert solutions to related follow-up questions below.
Follow-up Question

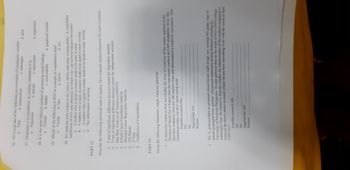
Transcribed Image Text:DATE
a. Time
36. All except one of the following are examples of continuous variable.
b. temperature
c. marriages
d area
37. Parameter is to population, as estimate (statistics) is to
a. Projection
b. sample
c. correlation
d. regression
a
38. It is the most effective method of presenting result findings.
Textual b. tabular
c. semi-tabular
d. graphical method
39. Which of the following is NOT an example of a qualitative data?
8. Course
b. race
C. Scores
d. sex
40. Six students were ranked in the oratory ability and essay writing ability. A correlation
coefficient of 0.66 was obtained. In which way, can we best interpret the result?
a. A student who is good in oratory tends to be poor in essay.
b. A student who is poor in oratory tends to be good is essay writing.
C.
A student who is good in oratory tends to be good in essay writing
d. The information is lacking
PART 11.
Describe the following statistical tools (3 points). Give example studies/situations for each (2 points)
1. T-test of significant difference between means for dependent samples
2.
T-test of significant difference between means for independent sampics
3. Onc Way Analysis of Variance (ANOVA)
4.
Simple Linear Correlation Analysis
5. Multiplc Linear Regression Analysis
6. Chi-Squarc
7. Z-Test
8. Coefficient of Concordance
PART IV.
Given the following Situations, supply what are asked for
1
A researcher wants to find out whether the level of creativity of the master teachers in the
Division of Ilocos Sur is higher than the non-master teachers at 0.005 probability level. She
therefore randomly selected 500 teachers from and administered a creativity instrument. This
instrument make use of a5 point rating scale.
Possible research title:
Ho:
Ha:
Appropriate test: __
Reason:
2
Mr. X, gathered data on personal-related factors such as age, sex, average HS grade, type of
school graduated from, parents' educational attainment among freshmen entering the
University of Northern Philippines. He also gathered data on the result of their UNP-College
Admission Test. He wanted to find out whether the characteristics of the students measured in
terms of the above-stated personal-related factors have something to do with the result of their
UNP CAT.
Possible research title:
Ho:
Ha:
Appropriate test:
Reason:

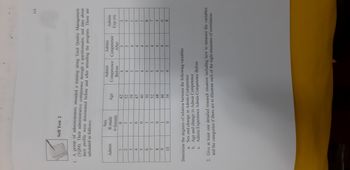
Transcribed Image Text:115
Self Test 2
1. A group of administrators attended a training along Total Quality Management
(TQM). Their administrative competence through a questionnaire, and data about
tabulated as follows:
their profile were determined before and after attending the program. These are
Sex
R-male
0-female
Admin
1
Age
Admin
Competence
Before
Admin
Competence
After
Admin
Exp yrs.
0
42
4
5
3
1
52
4
5
5
1
39
3
4
1
0
47
3
4
5
0
40
4
4
1
6
1
50
5
5
8
7
1
52
5
4
7
0
48
4
4
4
9
1
46
5
4
6
10
0
54
4
5
8
Determine the degrees of relation between the following variables
a.
Sex and change in Admin Competence
b.
Age and change in Admin Competence
c. Admin Experience Admin Competence Before
2. Give at least one detailed research situation including how to measure the variables
and the categories if there are to illustrate each of the eight measures of correlation.
234N
5
Solution
Recommended textbooks for you

MATLAB: An Introduction with Applications
Statistics
ISBN:
9781119256830
Author:
Amos Gilat
Publisher:
John Wiley & Sons Inc

Probability and Statistics for Engineering and th…
Statistics
ISBN:
9781305251809
Author:
Jay L. Devore
Publisher:
Cengage Learning

Statistics for The Behavioral Sciences (MindTap C…
Statistics
ISBN:
9781305504912
Author:
Frederick J Gravetter, Larry B. Wallnau
Publisher:
Cengage Learning

MATLAB: An Introduction with Applications
Statistics
ISBN:
9781119256830
Author:
Amos Gilat
Publisher:
John Wiley & Sons Inc

Probability and Statistics for Engineering and th…
Statistics
ISBN:
9781305251809
Author:
Jay L. Devore
Publisher:
Cengage Learning

Statistics for The Behavioral Sciences (MindTap C…
Statistics
ISBN:
9781305504912
Author:
Frederick J Gravetter, Larry B. Wallnau
Publisher:
Cengage Learning

Elementary Statistics: Picturing the World (7th E…
Statistics
ISBN:
9780134683416
Author:
Ron Larson, Betsy Farber
Publisher:
PEARSON

The Basic Practice of Statistics
Statistics
ISBN:
9781319042578
Author:
David S. Moore, William I. Notz, Michael A. Fligner
Publisher:
W. H. Freeman

Introduction to the Practice of Statistics
Statistics
ISBN:
9781319013387
Author:
David S. Moore, George P. McCabe, Bruce A. Craig
Publisher:
W. H. Freeman