30 days. These are the results for those that responded "yes” “8th graders - 34% 10th graders -48% 12th graders-68% We want to know if the use of alcohol is the same for all students or if there is a significant difference. (c) Assume that the results are based on a simple random sample of 100 students from each grade for a total of 300 students surveyed. Perform the appropriate statistical test and report the test statistic and the p value. (d) Is the result significant at a 5% decision value? What does this mean in terms of accepting or rejecting the null hypothesis?


A survey of randomly selected 8th, 10th and 12th graders from Humboldt County were asked if they used alcohol within the last 30 days. These are the results for those that responded "yes”
“8th graders - 34%
10th graders -48%
12th graders-68%
We want to know if the use of alcohol is the same for all students or if there is a significant difference.
(c) Assume that the results are based on a simple random sample of 100 students from each grade for a total of 300 students surveyed. Perform the appropriate statistical test and report the test statistic and the p value.
(d) Is the result significant at a 5% decision value? What does this mean in terms of accepting or rejecting the null hypothesis?
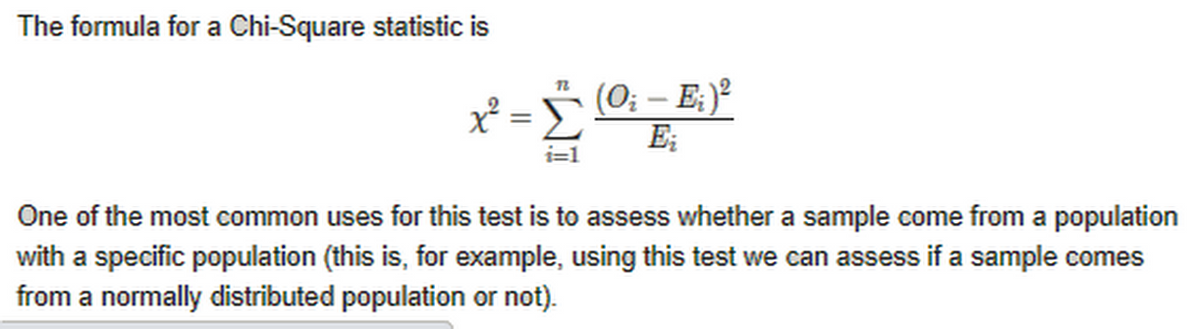
A Chi-Square for goodness of fit test is a test used to assess whether the observed data can be claimed to reasonably fit the expected data. Sometimes, a Chi-Square test for goodness of fit is referred as a test for multinomial experiments, because there is a fixed number of N categories, and each of the outcomes of the experiment falls in exactly one of those categories. Then, based on sample information, the test uses a Chi-Square statistic to assess if the expected proportions for all categories reasonably fit the sample data. The main properties of a one sample Chi-Square test for goodness of fit are:
- The distribution of the test statistic is the Chi-Square distribution, with n-1 degrees of freedom, where n is the number of categories
-
- The Chi-Square distribution is one of the most important distributions in statistics, together with the normal distribution and the F-distribution

Step by step
Solved in 2 steps with 3 images


