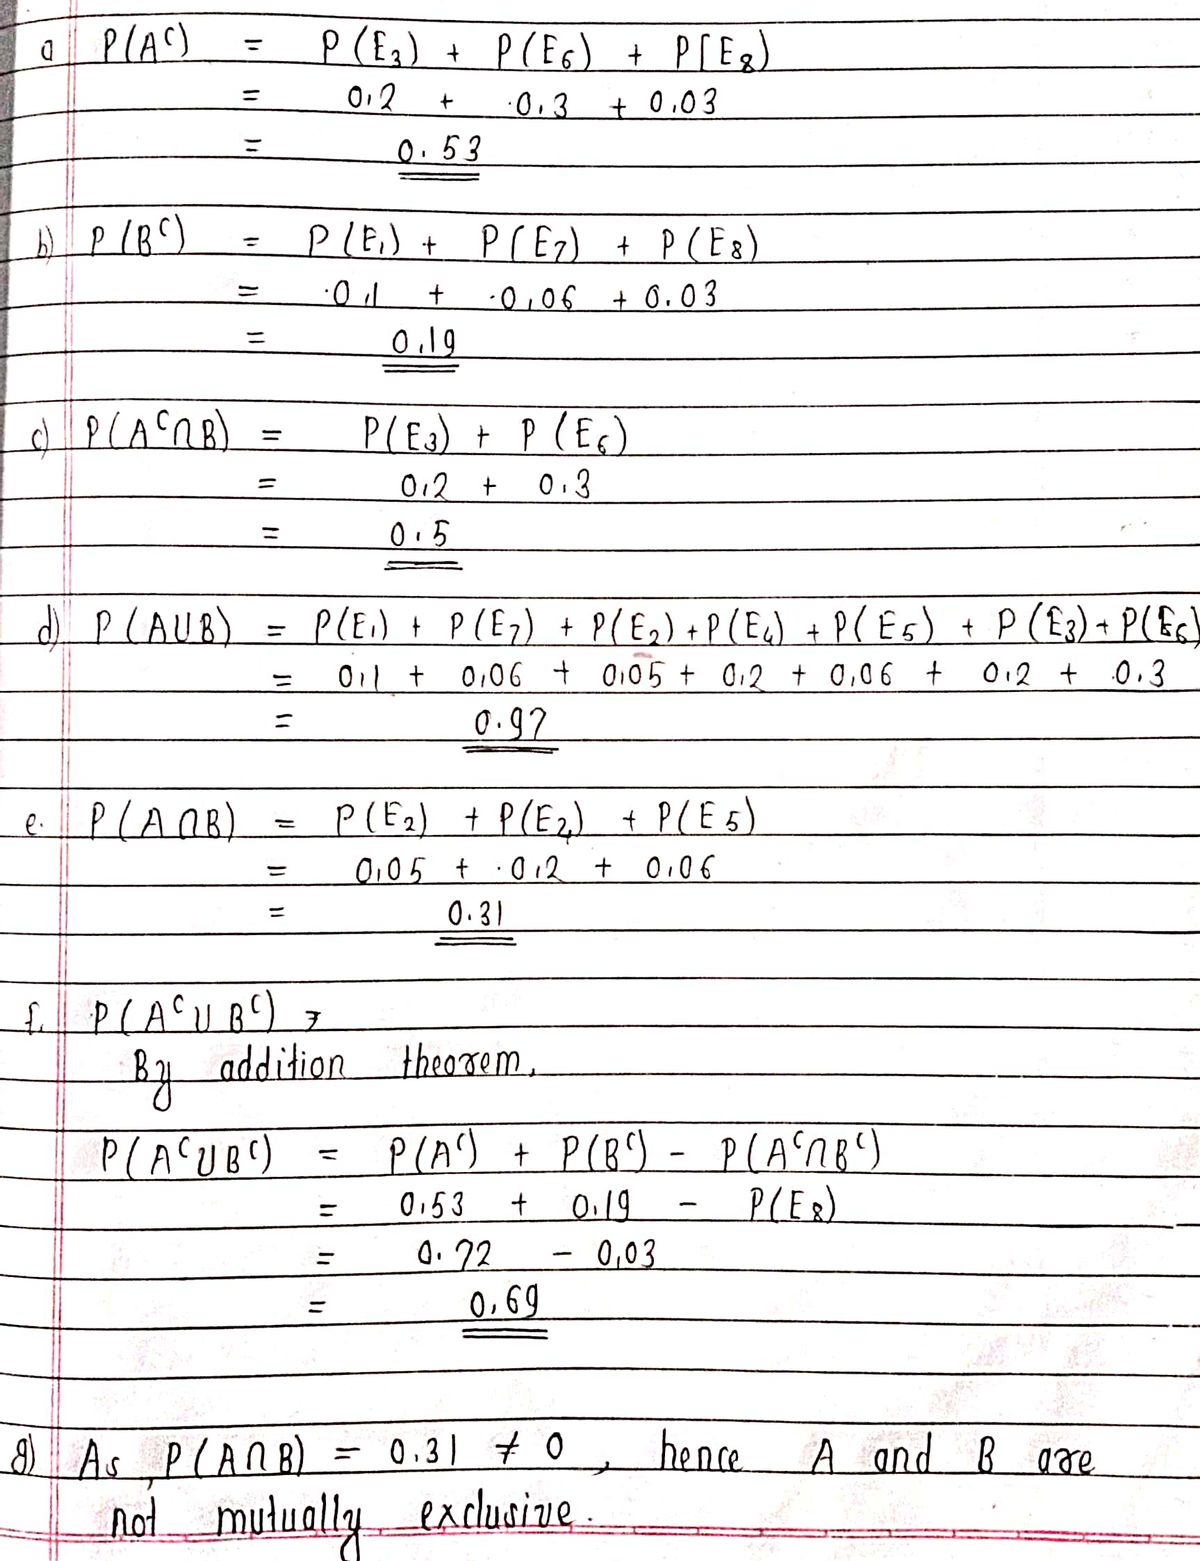
3.48 Consider the following Venn diagram, where P(E1) = .10, P(E2) = .05, P(E3) = P(E4) = .2, %3D P(Es) = .06, P(E6) = .3, P(E,) = .06, and P(Es) = .03: •E1 OE2 B OES E OES A Find the following probabilities: a. P(A°) b. Р(В°) c. P(A°NB) d. P(A U B) e. P(ANB) 1. P(AU B*) g. Are events A and B mutually exclusive? Why?
Q: Q3: price receivea ior the clocks depends on both the age of the clocks and the number of bidders at…
A: Given: The dependent variable Y is the Auction price The independent variables X1, X2 are Age and…
Q: Q3. [Multiple Choices] The following vis shows the population within different age groups among…
A: This question requires us to explain which of the following techniques is being deployed in the…
Q: Done 12 of 12 DIGIM MIOI FOU IO M I 0 I FOU FOU…
A: Given, Elina found 0.7 as the proportion in her original sample. Clare found 0.75 as the proportion…
Q: For a relationship involving education and library use, gamma was +0.37. This indicates that…
A: Correct answer is (d) library use increases with education
Q: 3. Let P(A|B) = 0.40 and P(A N B) = 0.1. Find P(B).
A:
Q: Professor Gersch loves, as everyone should, to collect and analyze statistical information. He…
A: In simple linear regression there will be only one independent variable. In multiple linear…
Q: arch report states that t(18)=+3.09, p<. 05. For this test, r2 =. 33. True
A: Given: df = 18 test value (t) = 3.09
Q: Suppose a biologist collected data on the weight of 50 lab rats that were 3 weeks old. The boxplot…
A: We want to tell a skewness from box plot in given question
Q: You work for an insurance company and are studying the relationship between types of crashes and the…
A: [O] Car pickup sport utility TotalSingle 876…
Q: Using the results r(128) = –.64, p > .05, what is the most appropriate conclusion? A. r is not…
A: It is given that:The value of correlation coefficient between X and Y for 128 observations: The…
Q: Find the z-score that cuts off 65% in the body on the left. (Hint: if you can’t find that EXACT…
A:
Q: A student is studying the migration pattems of several birds. She collects the data in the table.…
A: Given that a student is studying the migration patterns of several birds. She collects the data in…
Q: Qall 53% 6:24 B. X Suppose n(A) = 10, n(B) = 26, and n(A U B)=31. Use a Venn diagram to find n(An…
A:
Q: feels that the commute in his city is less and wants to publicize this. He randomly selects 25…
A: The hypotheses are given as follows: Null hypothesis: µ=25.4. Alternative hypothesis: µ<25.4.…
Q: Find PQ. 5x +16 S. 9X-32 Q
A: We are solving the first question and for the next question post the question again and also mention…
Q: The pie chart shows the distribution of the opinions of parents on whether a college education is…
A: It is needed to test the claim whether the distribution of the opinions of teenagers is different…
Q: A scientist suspects that as a person’s stress level changes, so does the amount of his or her…
A: Given that, A scientist suspects that as a person’s stress level changes, so does the amount of his…
Q: Write introduction of 2 factorial designs with respect to its application in manufacturing industry.…
A: In the present scenario 2k factorial experiments are used in many manufacturing industries includes…
Q: . At a local ice-cream store, 210 people were surveyed on whether they preferred eating ice cream…
A: The total number of people is n = 210.
Q: This relative frequency histogram shows the distribution of daily rainfall (in centimeters) for a…
A: Analyse the histogram.
Q: During the summer of 2020, about 68% of San Diego young adults played a game called Animal Crossing.…
A:
Q: The following relationships between wage (W) and education (EDU) are estimated using a sample of 100…
A: The given regression model is: The Sum of squares are given as:The sampled size, i.e., the sampled…
Q: If P(A) + P(B) = 0.9, P(A n B) = P(B nA) = 0.25 ,Then %3D %3D %3D P(AN B) = %3D
A: P(A∩B) = 0.2
Q: 1f. It has been reported that the first week in May NC has an average daily temperature of 88…
A: Average daily temperature of first week in May is 88 degrees. The first week had recorded…
Q: Nationally, 60.2% of federal prisoners were serving time for drug offenses in 2015. A warden felt…
A: According to the given information,Population proportion, p = 60.2% = 0.602Claim:- A warden felt…
Q: The z statistic for a test of Ho:p = 0.4 versus Haip + 0.4 is z = 2.43. This test is %3D %3D (a) not…
A: The single mean z-test contains two hypotheses: null hypothesis and alternate hypothesis. The…
Q: On a psychology exam with µ = 76 and o = 12, Tom scored 9 points below the mean (M), Mary %3D had a…
A: Given, On a psychology exam with μ =76 and σ=12, Tom scored 9 points below the mean(M), Mary had a…
Q: appropriate 2x2 table. What is the relative risk (risk ratio) of depression associated with…
A: Given that, The two variables are lack of employment and depression. The results in the 2*2 table…
Q: We have to determine the UCL and the LCL by applying the above formulae to the data given in Example…
A:
Q: Researchers conducted a telephone survey of 427 adults living in a large city. The adults were asked…
A: Graphs are an excellent tool to summarize data visually.
Q: Suppose it was observed that there is a correlation of r= -0.81 between a driver's age and the cost…
A: Since we know that negative correlation is defined as relationship between two variables in which if…
Q: Temperature has a direct correlation with aggression. Knowing this, a researcher predicts that…
A:
Q: Suppose you have four classifications: freshmen (f), sophomore (so), junior (j), and senior (se).…
A: Given data suppose you have four classifications freshmen (f) sophomore(so) junior(j) senior(se)…
Q: You work for an insurance company and are studying the relationship between types of crashes and the…
A: Answer [O] Y1 Y2 Y3X1 866 323 340X2 1145 487…
Q: Which of the following correctly describes the interpretation of an r2 statistic of 0.673 in a model…
A: Here, dependent variable is frequency of hospital visits (Y), independent variable is BMI (kg/m2)…
Q: For the 17 girls who received the family therapy, the changes in weight during the study (which are…
A: 1. The changes in weight for 17 girls are given.
Q: (5.) As mobile phones continue to proliferate, more and more people will watch video content on…
A:
Q: T1. Colors in print media, on computer monitors, and on televi- sion screens are implemented using…
A: The conversion from model to the is accomplished by the matrix We have to find the matrix used to…
Q: In a survey of 1150 adult males, 805 said they use the Internet. In a survey of 1050 females, 746…
A:
Q: What size samples do you need for a 2-group design if you expect to have an effect size of .50 and…
A: Type of experiment: 2-group design (2 samples independent test) Designated Power: 0.71 Effect size:…
Q: In a class of 100 students, 42 students like Economics and 56 students like Art. 10 students don't…
A: Denote: E: likes Economics A: Likes Arts AUE: Likes Economics or Arts A∪E: Likes Economics and Arts…
Q: Q.3 A teacher finds that for test grades in Class A, X = 32 and S x 4; for test grades in Class B, X…
A: The teacher should use measure of central tendency (arithmetic mean) to get a representative of the…
Q: NEW STUDY: Dr. Apnea conducted a study investigating the effects of sleep deprivation on complex…
A: Statistically significant mean decrease of 4.7 means that there is a significant effect of sleep on…
Q: How is the hatching of water python eggs influenced by the temperature of the snake's nest?…
A: Cramer's V is a measure of association used to determine the strength of the relationship between…
Q: Suppose instead, you obtained the following data: Afternoon Testing Morning Testing M= 15 Older…
A: Given: Morning Testing Afternoon Testing Older Adults 15 15 Younger Adults 19 20
Q: The CDC (Center for Disease Control) did a study to see if there is an association between lung…
A:
Q: r. Lyte wishes to study speed of Reaction Time to press a button in response to the onset of a lamp.…
A: Introduction: A confounding variable in a study is a variable that has an effect on the response…
Q: Co-sleepers night time crying in minutes: 8, 4, 7, 7, 6 Crib-sleepers…
A: The provided information is For Co-sleepers night 8,4,7,7,6 Σx1=32,Σx12=214 x¯1=Σx1n1=6.4The…
Trending now
This is a popular solution!
Step by step
Solved in 2 steps with 1 images
- 7) The y for the association between job satisfaction and happiness is 0.40. Does the f of 0.22 represent a stronger or weaker association than the p of 0.40?... 11:32 PM Tue Jan 19 * 48% AA A etext-ise.pearson.com PB Introduction - Orego... E еТеxt P Course Home - Diam... Pearson eText PRACTICE Find three numbers such that the second number is 8 less than triple the first number, the third number is five times the first number, and the sum of the three numbers is 118.7.16 Using an app or the Web on a smartphone. The Nielsen Company reports that U.S. residents aged 18 to 34 years spend an average of 2.83 hours per day using an app or the Web on a smartphones You wonder if this it true for students at your large university because you rarely see students not using their smartphones. You collect an SRS of n = 75 students and obtain 2 = 3.17 hours with s =1.36 hours. (a) Report the 95% confidence interval for u, the average number of hours per month that students at your university use the Internet on a computer. (b) Use this interval to test whether the average time for students at your university is different from the average, reported by Nielsen. Use the 5% significance level. Summarize your results.
- The table gives the percent of total households that have married couples for selected years from 1982 and projected to 2050. Complete parts (a) through (c) below. ^ a. Find the quadratic function that best models the data, with x representing the number of years after 1980 and y representing the percent. y=(x²+x+) (Type integers or decimals rounded to three decimal places as needed.) b. Graph the function and the data points on the same axes. Choose the correct graph below. OA. 40 6 17 & + 7 OB. hp f8 * 4+ 8 H 9 O C. Year 1982 1990 2000 2010 f10 O Percent Year 59 2020 56 2030 54 2040 49 2050 Q Q fn OD. f12 Percent 47 46 45 44 + Q Q Next = insertQ23. A social psychologist records the number of outbursts in a sample of different classrooms at a local school. Answer the questions based on the statement below. (Note: These are not the results from Q19) The number of outbursts among students at this local school (M = 3) was significantly less than that in the general population, t(39) = 4.19, p < .05, d = .25. 23a. What was the sample size?n = 23b. What was the decision?A. Retain H0B. Reject H0Decision = 23c. What was the effect size?A. 39B. 4.19C. .05D. .25 Effect size =OSuppose that for a certain experiment P(A) = .47 and P(B) = .25 and P(An B) = .14. Find P(Au B).
- 46 461 12:17 13 O ... 4G2 58% 20210501_1012... ... (a) Find the correlation co-efficient between X and Y, given 12 14 16 18 21 22 23 25 Y 11 16 15 20 17 19 25 24 21 (P.U., M.A. Econ. 1969) (b) Find the co-efficient of correlation between persons employed and cloth manufactured in a textile mill. Interpret the result. Persons employed 137 209 113 189 176 200 219 Cloth manufactured ('000 yds) 23 47 22 40 39 51 49Given N-10, Στ= 140, Σy= 150, Σ(r-10)-180 E(y-15) = 215, E(x – 10)(y -15) = 60 h to Find K.P. Coefficient of Correlation and estimate the value of y when x = 15You work for an insurance company and are studying the relationship between types of crashes and the vehicles involved. As part of your study, you randomly select 3589 vehicle crashes and organize the resulting data as shown in the contigency table. At α=0.10, can you conclude that the type of crash depends on the type of vehicle? Complete parts (a) through (d). Vehicle Type of crash Car Pickup Sport utility Single-vehicle 866 323 340 Multiple-vehicle 1145 487 428 Question content area bottom Part 1 (a) Identify the claim and state the null and alternative hypotheses. H0: The type of crash and the type of vehicle are ▼ independent dependent . Ha: The type of crash and the type of vehicle are ▼ dependent independent . The ▼ alternative hypothesis null hypothesis is the claim.
- A physician wants to see if there was a difference in the average smokers' daily cigarette consumption after wearing a nicotine patch. The physician set up a study to track daily smoking consumption. In the study, the patients were given a placebo patch that did not contain nicotine for 4 weeks, then a nicotine patch for the following 4 weeks. Test to see if there was a difference in the average smoker's daily cigarette consumption using α = 0.01. The hypotheses are: H0 : μD = 0 H1 : μD ≠ 0 t-Test: Paired Two Sample for Means Placebo Nicotine Mean 18.75 12.3125 Variance 66.599 34.6667 Observations 16 16 Pearson Correlation 0.6105 Hypothesized Mean Difference 0 df 15 t Stat 3.5481 P(T<=t) one-tail 0.0126 t Critical one-tail 2.6025 P(T<=t) two-tail 0.0252 t Critical two-tail 2.9467 What is the correct p-value? Question 1 options:…Interpret the effect size (η2) for the following: t(30) = 1.12, p = .34, η2 = .002A teacher has found that his class performed particularly well on a quiz when the material was related to pop culture (M= 77) compared with normal quiz performance (u= 69, 0 =20 ). What is the effect size for this effect? Select one: • a. 0.40 e b. 1.57 • c. 0.94 • d. -0.94 e e. All of the above