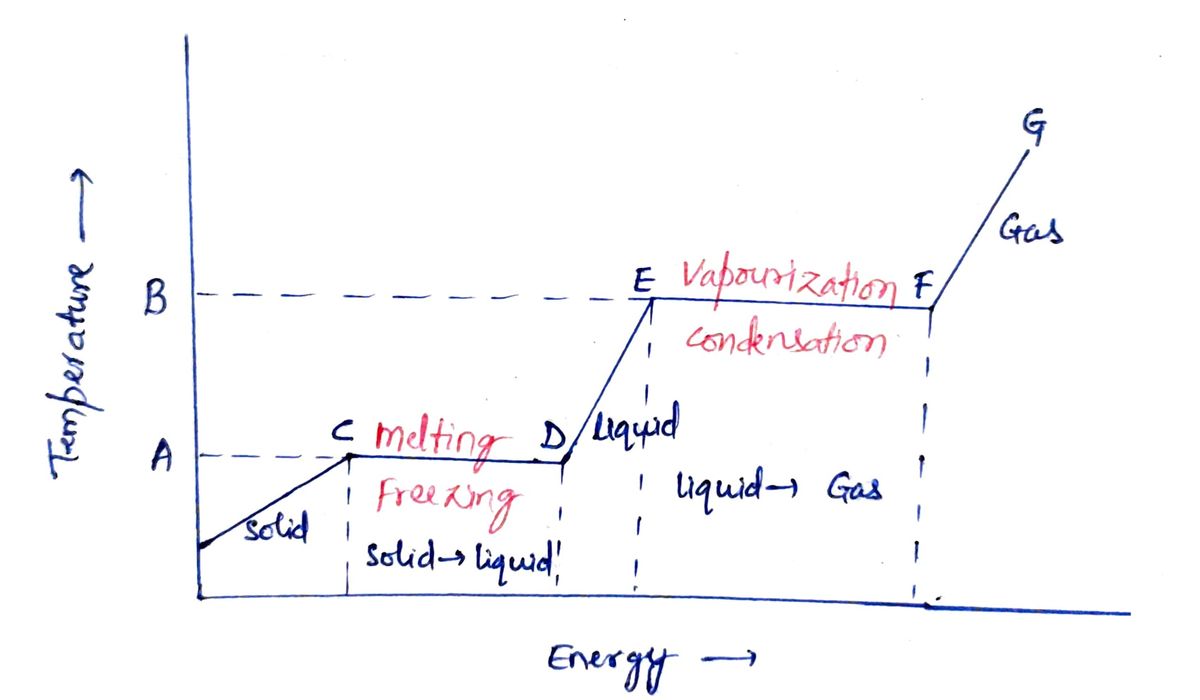
3. Use the diagram to answer the following: 101 di haigge pe a. Identify the point of the graph where each of the following occurs. i. melting begins iii. boiling begins ii. freezing begins iv. condensation begins b. Suppose you have 10grams of water at Temperature B A C Solid A and B are temperatures; The others are points on the graph D Solid-Liquid Liquid PERAT E F Liquid Gas Gas G

Chemistry
10th Edition
ISBN:9781305957404
Author:Steven S. Zumdahl, Susan A. Zumdahl, Donald J. DeCoste
Publisher:Steven S. Zumdahl, Susan A. Zumdahl, Donald J. DeCoste
Chapter1: Chemical Foundations
Section: Chapter Questions
Problem 1RQ: Define and explain the differences between the following terms. a. law and theory b. theory and...
icon
Related questions
Question
Please help with question 3
**3. Use the diagram to answer the following:**

- **a. Identify the point of the graph where each of the following occurs:**
  - i. Melting begins: Point C
  - ii. Freezing begins: Point D
  - iii. Boiling begins: Point E
  - iv. Condensation begins: Point F

- **b. Suppose you have 10 grams of water at 25°C. What do you need to do to get the 10 grams of water to point C?**
  - Increase energy/temperature to reach the melting point.

**Graph Description:**
The graph depicts the relationship between temperature and energy for a substance. It is divided into phases: Solid, Solid → Liquid, Liquid, and Liquid → Gas. Points C and D represent phase transitions (melting and freezing), while points E and F represent boiling and condensation.

**4. Using the phase diagram to the right:**

- **a. Label each phase in the diagram to the right in the box provided.**
  
- **b. What are the normal melting and normal boiling points?**
  - At 1 atm, the melting point is approximately 54.4K, and the boiling point is approximately 90.2K.

- **c. What is the phase change associated with letter A when the pressure is suddenly dropped?**
  - Phase change from Solid to Gas (sublimation).

- **d. What singular change can you do to letter B to vaporize it?**
  - Increase temperature to reach the boiling point.

- **e. What is happening on the molecular level for your answer in part D to work?**
  - As temperature increases, the kinetic energy of the molecules increases, allowing them to overcome intermolecular forces and transition from liquid to gas.

**Diagram Description:**
The phase diagram shows temperature (Kelvin) on the x-axis and pressure (atm) on the y-axis. It highlights regions of solid, liquid, and gas, with a curve depicting the phase boundaries. The critical points are marked, showing transitions such as sublimation and vaporization under different conditions.
Transcribed Image Text:**3. Use the diagram to answer the following:** - **a. Identify the point of the graph where each of the following occurs:** - i. Melting begins: Point C - ii. Freezing begins: Point D - iii. Boiling begins: Point E - iv. Condensation begins: Point F - **b. Suppose you have 10 grams of water at 25°C. What do you need to do to get the 10 grams of water to point C?** - Increase energy/temperature to reach the melting point. **Graph Description:** The graph depicts the relationship between temperature and energy for a substance. It is divided into phases: Solid, Solid → Liquid, Liquid, and Liquid → Gas. Points C and D represent phase transitions (melting and freezing), while points E and F represent boiling and condensation. **4. Using the phase diagram to the right:** - **a. Label each phase in the diagram to the right in the box provided.** - **b. What are the normal melting and normal boiling points?** - At 1 atm, the melting point is approximately 54.4K, and the boiling point is approximately 90.2K. - **c. What is the phase change associated with letter A when the pressure is suddenly dropped?** - Phase change from Solid to Gas (sublimation). - **d. What singular change can you do to letter B to vaporize it?** - Increase temperature to reach the boiling point. - **e. What is happening on the molecular level for your answer in part D to work?** - As temperature increases, the kinetic energy of the molecules increases, allowing them to overcome intermolecular forces and transition from liquid to gas. **Diagram Description:** The phase diagram shows temperature (Kelvin) on the x-axis and pressure (atm) on the y-axis. It highlights regions of solid, liquid, and gas, with a curve depicting the phase boundaries. The critical points are marked, showing transitions such as sublimation and vaporization under different conditions.
Expert Solution
Step 1

Chemistry homework question answer, step 1, image 1

steps

Step by step

Solved in 2 steps with 2 images

Blurred answer
Knowledge Booster
Matter
Learn more about
Need a deep-dive on the concept behind this application? Look no further. Learn more about this topic, chemistry and related others by exploring similar questions and additional content below.
Similar questions
  • SEE MORE QUESTIONS
Recommended textbooks for you
Chemistry
Chemistry
Chemistry
ISBN:
9781305957404
Author:
Steven S. Zumdahl, Susan A. Zumdahl, Donald J. DeCoste
Publisher:
Cengage Learning
Chemistry
Chemistry
Chemistry
ISBN:
9781259911156
Author:
Raymond Chang Dr., Jason Overby Professor
Publisher:
McGraw-Hill Education
Principles of Instrumental Analysis
Chemistry
ISBN:
9781305577213
Author:
Douglas A. Skoog, F. James Holler, Stanley R. Crouch
Publisher:
Cengage Learning
Organic Chemistry
Organic Chemistry
Chemistry
ISBN:
9780078021558
Author:
Janice Gorzynski Smith Dr.
Publisher:
McGraw-Hill Education
Chemistry: Principles and Reactions
Chemistry
ISBN:
9781305079373
Author:
William L. Masterton, Cecile N. Hurley
Publisher:
Cengage Learning
Elementary Principles of Chemical Processes, Bind…
Chemistry
ISBN:
9781118431221
Author:
Richard M. Felder, Ronald W. Rousseau, Lisa G. Bullard
Publisher:
WILEY