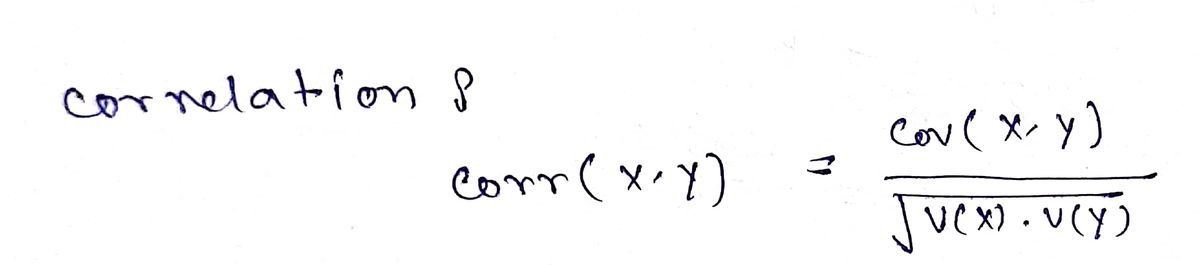
3. If X and Y have the relation X + Y = 2 then the correlation of X and Y (p) is -1. True or False? Give reasoning.
Q: 7. Find correlation coefficient 'r' of the folling equation. 4x + 5y = 18 3x + 12y = 32
A: Given: we have two regression lines as below 1] 4x+5y = 10 that is 4x+5y-18 =0…
Q: Based on the Scatterplot and the calculated value of r, write a comment to explain in a sentence the…
A: As the correlation coefficient is closer to +1, it indicates that there is strong positive…
Q: Sociologists suspect there's is a relationship between education level and level of social activity…
A: It is needed to test, whether the there is a relationship between education level and level of…
Q: If a linear relation exists between the variables x and y, then the coefficient of correlation…
A:
Q: Answer the following questions. The same response may be the correct answer for more than one…
A: (a) Identify the data set where it has an apparent negative, but not perfect linear relationship…
Q: A study of a relation between "Price" and "Demand" had made for a sample of 6 Items: → 2 values are…
A: To check the existence of a linear relation we make a scatter plot between Price (X) and Demand (Y)…
Q: State with reasons whether the following statements are true or false. 1. Coefficient of correlation…
A:
Q: Is there a linear relationship between the distance of a house from a fire station and the fire…
A: 2a. The value of r(correlation) between X and Y is 0.96098 and it is calculated by Excel function,…
Q: B. 0.4941 of the change in variable Explain the coefficient of determinationin table 7 Using table…
A: From the given output, The regression equation isY=49.4549+0.5137X Correct option: option L. From…
Q: Which of the following scatterplots indicates a strong negative linear relationship between X and Y?…
A: Given there are four scatter plot, we have to choose which of the following scatter plots indicates…
Q: From lecture, we learned that relationships between variables can be described through all of the…
A: Various parameters that describe relationships between variables are listed. Among them is a…
Q: Identify the type of correlation. 94Y 8- 7-1 6- 10 4 3- 2- 1- Price per Pizza Class Demand for Pizza…
A: Here we have to identify the correct statement for given scatter plot
Q: Which of the following describe dependent variables?
A: In statistics, a dependent variable is the outcome or phenomenon that the researcher is studying. It…
Q: Do the two variables have a linear relationship? O A. The data points do not have a linear…
A:
Q: a. I and IV b. II and III c. III and IV d. I, II, III, and IV I. II. III. IV. y = 3x - 6 y = x y =…
A: Given equations:- y=3x-6 y=23x y=-x y=x+1
Q: Floor Space (square feet) 6,060 5,230 4,280 5,580 We
A:
Q: Which one displays a proportional relationship?
A:
Q: Determine whether the scatter diagram indicates that a linear relation may exist between the two…
A: For the given plot Do have linear relationship ? Variables association ?
Q: If a third variable is in fact a confounder of the relationship between two variables, it will…
A: 1. If a third variable is in fact a confounder of the relationship between two variables, it will…
Q: Explain why the hypothesis test H0:β1=0H0:β1=0 vs. Ha:β1≠0Ha:β1≠0 is called the test of no linear…
A: Hypothesis test for regression slope : It is a hypothesis test to determine whether there is a…
Q: Which score has a higher relative position: a score of 80 on a test for which = 60 and s =…
A: Given information: For 80: The mean is x¯=60. The standard deviation is s=10. For 250: The mean is…
Q: line of fit was drawn through the scatter plot shown on the right. Find the equation of the line of…
A: finding the equation of line passes through points (4,8) and (6,11)
Q: Which of the following statements is always true? A.If the correation coefficent r = 0, then this…
A: The correlation coefficient(r) value always between -1 ≤ r ≤ 1.
Q: A study of a relation between "Price" and "Demand" had made for a sample of 6 Items: → 2 values are…
A: The given data is Price (Xi) Demand(Yi) 70 18 75 23 80 10 85 16 90 17 95 15 We…
Q: Determine whether the scatter diagram indicates that a linear relation may exist between the two…
A: Given: Scatter diagram for two variables. Do the two variables have a positive or a negative…
Q: A positive relationship exists when both variables increase or decrease at the same time. 1) True 2)…
A:
Q: What is a scatter diagram? Draw the scatter diagram when (i) r = +1, (ii) r = -1 and (iii) r = 0.…
A:
Q: Identify which of the two variables is the independent variable x and which is the dependent…
A:
Q: Which of the following is true about the direction of the relationship between education and health?…
A: First let's discuss about correlation.Correlation is defined as the proportion of the strength of a…
Q: Two pair misread values. A computer while calculating she correlation coefficient.between two…
A:
Q: 2. You are president of the high school band booster club. You have arranged for school's jazz band…
A: Given that, The President has arranged for the school's jazz band to perform at a local coffee shop…
Q: Which of the following statements is true? 1. The R (ie, R-squared) tells us the percentage of the…
A: By the definition of R-squared, it tells the percentage of variation in the dependent variable that…
Q: An insurance company found the relationship between driver age (x, in years) and car insurance…
A: Given an insurance company found the relationship between driver age (x, in years) and car insurance…
Q: relation is linear, detemine Wnetner it Indicates a positive or negative association between the…
A: The Negative and positive correlation are determined below as follows: Positive correlation:…
Step by step
Solved in 2 steps with 2 images
- What is the interpretation of r= - 0.12? O There is a weak negative linear relationship between X and Y O There is a weak positive linear relationship between X and Y There is a strong negative linear relationship between X and Y O There is a strong positive linear relationship between X and YFor each problem, select the best response. (a) In a scatterplot of the average price of a barrel of oil and the average retail price of a gallon of gasoline, you expect to see A. a positive association. B. very little association. C. a negative association. D. None of the above. (b) What are all the values that a correlation r can possibly take? A. -1 ≤ ≤ r ≤ ≤ 1 B. r ≥ ≥ 0 C. 0 ≤ ≤ r ≤ ≤ 1 D. None of the above. (c) You have data for many years on the average price of a barrel of oil and the average retail price of a gallon of unleaded regular gasoline. When you make a scatterplot, the explanatory variable on the x -axis A. is the price of oil. B. is the price of gasoline. C. can be either oil price or gasoline price. D. None of the aboveHi! I need help finding the answers in the yellow boxes please :) Thank you so so much!!
- Pls explain the selected option in 5-6 sentence only Which of the following statement(s) are false? (Select all that apply.) a) Correlation measures the strength of a linear relationship between two quantitative variables.-1 ≤ r ≤ 1 b) The sign of r tells the direction of the linear relationship between two quantitative variables. c) The correlation has the same units (e.g., feet or minutes) as the explanatory variable. d) If the correlation between two quantitative variables is zero, then there cannot be a relationship between these two variables.16)Let x be the average number of employees in a group health insurance plan, and let y be the average administrative cost as a percentage of claims. x 3 7 15 32 75 y 40 35 30 26 18 (a) Make a scatter diagram of the data and visualize the line you think best fits the data. Flash Player version 10 or higher is required for this question. You can get Flash Player free from Adobe's website. (b) Would you say the correlation is low, moderate, or strong? positive or negative? strong and negative moderate and negative strong and positive low and negative low and positive moderate and positive (c) Use a calculator to verify that Σx = 132, Σx2 = 6932, Σy = 149, Σy2 = 4725, and Σxy = 2997. Compute r. (Round your answer to three decimal places.)r = As x increases, does the value of r imply that y should tend to increase or decrease? Explain. Given our value of r, we cannot draw any conclusions for the behavior of y as x increases. Given our value of r, y should tend to…
- 7. In an experiment, a balloon was dropped from various heights and the time it took to fall to the floor was recorded. Height (m) 0.5 1.0 1.5 2.0 2.5 3.0 3.5 4.0 0.3 0.5 0.7 0.9| 1.1| 1.3 1.5 1.7 Time (s) a) Is the relationship linear? Explain your reasoning. b) Use algebra to determine the equation of the line of best fit. c) Use the line of best fit to determine the time it would take for the balloon to drop to the floor from 5.0 m.One of the lines in the following scatter plot is the regression line fitted to the data. Which of the statements are correct?I need help with all of them plz.