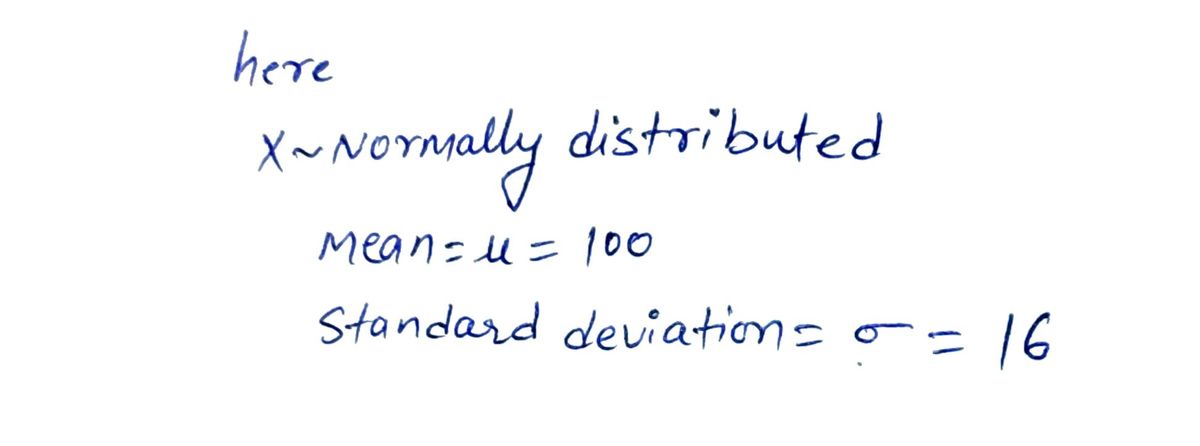
3. Identifying Extreme Values: Using the Normal Table in Reverse Steps: 1) Sketch the normal curve associated with the variable and locate the point that is of interest. 2) Use the standard normal table to obtain the z value corresponding to the point found in Step 1. 3) Obtain the x value having the z value found in Step 2. The following formula can be used to find the x value: x=z.0+H. 10=16 Example 6.4: Consider the IQ Scores in Example 6.2. 19505 94 95 Teacher took the average a. Find the 95th percentile of IQ scores. 100 X-00 16 「i695- そ100 X=1.645 x16 + 100= 126.3d b. Find the IQ score separating the bottom 10% from the top 90%. 5349 1003 -128=XーI00 T6 Example 6.5: A mandatory competency test for high school sonhomorer hog -1,28 79.52 with a mean of 400
3. Identifying Extreme Values: Using the Normal Table in Reverse Steps: 1) Sketch the normal curve associated with the variable and locate the point that is of interest. 2) Use the standard normal table to obtain the z value corresponding to the point found in Step 1. 3) Obtain the x value having the z value found in Step 2. The following formula can be used to find the x value: x=z.0+H. 10=16 Example 6.4: Consider the IQ Scores in Example 6.2. 19505 94 95 Teacher took the average a. Find the 95th percentile of IQ scores. 100 X-00 16 「i695- そ100 X=1.645 x16 + 100= 126.3d b. Find the IQ score separating the bottom 10% from the top 90%. 5349 1003 -128=XーI00 T6 Example 6.5: A mandatory competency test for high school sonhomorer hog -1,28 79.52 with a mean of 400
MATLAB: An Introduction with Applications
6th Edition
ISBN:9781119256830
Author:Amos Gilat
Publisher:Amos Gilat
Chapter1: Starting With Matlab
Section: Chapter Questions
Problem 1P
Related questions
Question
How do I turn a z value into an x value?
The example in class was this: IQ scores are
I attached a picture of the example.
I would really appreciate it if you could write an explanation for each step.

Transcribed Image Text:,9495 Teacher took
3. Identifying Extreme Values: Using the Normal Table in Reverse
Steps:
1) Sketch the normal curve associated with the variable and locate the point that is of interest.
2) Use the standard normal table to obtain the z value corresponding to the point found in Step 1.
3) Obtain the x value having the z value found in Step 2. The following formula can be used to
M=D100
5%60=D16
find the x value: x=z.o+H.
Example 6.4: Consider the IQ Scores in Example 6.2.
a. Find the 95th percentile of IQ scores.
.100
9505
Teacher toolk
the average
X-100
16
li645= X-100
To
%3D
X= 1.645 x16 + l00 = 126.3
%3D
b. Find the IQ score separating the bottom 10% from the top 90%.
534 1003
-1.28=x-100
16
-1,28
x16+100%3D79.52
Example 6.5: A mandatory competency test for high school sophomores has a normal distribution
with a mean of 400 and a standard deviation of 100.
I den + c ot
Expert Solution
Step 1

Step by step
Solved in 2 steps with 2 images

Recommended textbooks for you

MATLAB: An Introduction with Applications
Statistics
ISBN:
9781119256830
Author:
Amos Gilat
Publisher:
John Wiley & Sons Inc

Probability and Statistics for Engineering and th…
Statistics
ISBN:
9781305251809
Author:
Jay L. Devore
Publisher:
Cengage Learning

Statistics for The Behavioral Sciences (MindTap C…
Statistics
ISBN:
9781305504912
Author:
Frederick J Gravetter, Larry B. Wallnau
Publisher:
Cengage Learning

MATLAB: An Introduction with Applications
Statistics
ISBN:
9781119256830
Author:
Amos Gilat
Publisher:
John Wiley & Sons Inc

Probability and Statistics for Engineering and th…
Statistics
ISBN:
9781305251809
Author:
Jay L. Devore
Publisher:
Cengage Learning

Statistics for The Behavioral Sciences (MindTap C…
Statistics
ISBN:
9781305504912
Author:
Frederick J Gravetter, Larry B. Wallnau
Publisher:
Cengage Learning

Elementary Statistics: Picturing the World (7th E…
Statistics
ISBN:
9780134683416
Author:
Ron Larson, Betsy Farber
Publisher:
PEARSON

The Basic Practice of Statistics
Statistics
ISBN:
9781319042578
Author:
David S. Moore, William I. Notz, Michael A. Fligner
Publisher:
W. H. Freeman

Introduction to the Practice of Statistics
Statistics
ISBN:
9781319013387
Author:
David S. Moore, George P. McCabe, Bruce A. Craig
Publisher:
W. H. Freeman