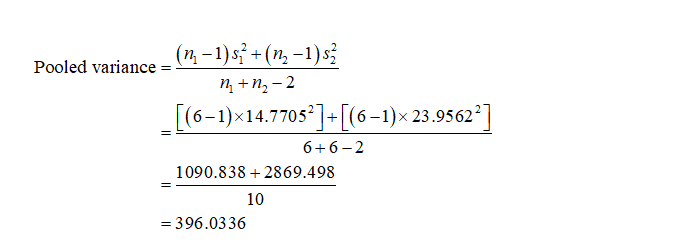
3. A researcher investigated the effects of cold on hypertension in rats by randomly assigning six rats to a 26°C environment and six to a 5°C environment and recording their blood pressures. Rat 3 10 11 12 Temp 26 26 26 26 26 26 5 5 5 5 (°C) Blood 152 149 176 157 182 179 369 354 423 366 375 384 Pressure LO (c) Construct a t-interval for the difference between the blood pressures of the two treatment groups. Use 95% confidence. Using the Values of the t-distribution (two-tailed) table the critical t-value is 2.228 Pooled variance =((6 – 1) * 14.7705² + (6 – 1) * 23.95622)/(6+ 6 – 2) = 396.0336 Lower Bound :(165.833 – 378.5) – 2.228 * (396.0 * (- +)) = -238.27 Upper Bound:(165.833 – 378.5) + 2.228 * (3960 ( + ) = -187.07


Please check my work:


(c)
Formula for confidence interval between two means:
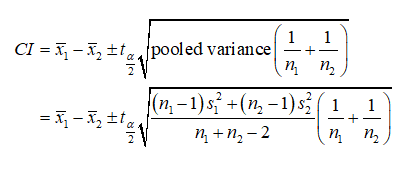
Degrees of freedom:
From the given information, n1=6 and n2=6.
The degree of freedom is, n1+n2 -2 = 6+6-2 =10.
The level of confidence is 0.95. Therefore, the level of significance is 1-0.95=0.05 and α/2=0.05/2=0.025.
From the t distribution table, the critical value corresponding with 10 degrees of freedom and 0.025 level of significance in “Area in one tail” is 2.228.
Pooled variance:
Calculation of Mean and Standard deviation for 26 degrees environment:
The mean value for the given sample observations is 165.833 and it is calculated by using Excel function, “=AVERAGE (A1:A6)”.
The standard deviation for the given sample is 14.7705 and it is calculated by using Excel function, “=STDEV (A1:A6)”.
Calculation of Mean and Standard deviation for 5 degrees environment:
The mean value for the given sample observations is 378.5 and it is calculated by using Excel function, “=AVERAGE (B1:B6)”.
The standard deviation for the given sample is 23.9562 and it is calculated by using Excel function, “=STDEV (B1:B6)”.
Therefore, the pooled variance is,

Trending now
This is a popular solution!

Step by step
Solved in 3 steps with 4 images


