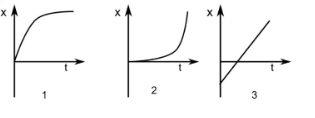
3. 05 & 6 X F 1 X T X KK 2 X X X AB 5 3 6 4 he position-time graphs for a car's motion in 6 scenarios are shown above. For each scenario, deduce (label on the raphs) 1. Starting point: Xo 2. Position after time t. 3. Is the car heading in the positive or the negative direction? Explain. 4 Is the car speeding up, slowing down (decelerating), or moving with constant velocity? Explain 5. On the x-t graphs, identify locations where the rate of change of x with time is large and small.

College Physics
11th Edition
ISBN:9781305952300
Author:Raymond A. Serway, Chris Vuille
Publisher:Raymond A. Serway, Chris Vuille
Chapter1: Units, Trigonometry. And Vectors
Section: Chapter Questions
Problem 1CQ: Estimate the order of magnitude of the length, in meters, of each of the following; (a) a mouse, (b)...
icon
Related questions
icon
Concept explainers
Topic Video
Question
The image displays six position-time graphs representing a car's motion. Each graph is labeled from 1 to 6. The horizontal axis (t) represents time, while the vertical axis (x) represents position.

### Graph Explanations:

1. **Graph 1:**
   - A straight horizontal line, indicating constant position over time.
   
2. **Graph 2:**
   - A curve that starts with a shallow slope, steepens as time progresses. 
   - Shows acceleration.

3. **Graph 3:**
   - A straight line with a positive slope.
   - Consistent, positive velocity.

4. **Graph 4:**
   - A straight line with a negative slope.
   - Consistent, negative velocity.

5. **Graph 5:**
   - A curve that starts steep and slowly levels out to flat.
   - Deceleration.

6. **Graph 6:**
   - A steep curve that becomes less steep over time.
   - Deceleration or a slowing rate of position change.

### Questions for Analysis:

1. **Starting point: \(x_0\)** 
   - Identify the initial position on each graph.

2. **Position after time \(t\):**
   - Determine the final position reached after a specified time interval.

3. **Is the car heading in the positive or negative direction? Explain.**
   - Evaluate whether the graph shows motion in the positive or negative direction based on the slope.

4. **Is the car speeding up, slowing down (decelerating), or moving with constant velocity? Explain.**
   - Analyze the shapes of the graphs for changes in velocity.

5. **On the x-t graphs, identify locations where the rate of change of \(x\) with time is large and small.**
   - Locate areas with steep slopes (large rate of change) and flat sections (small rate of change).
Transcribed Image Text:The image displays six position-time graphs representing a car's motion. Each graph is labeled from 1 to 6. The horizontal axis (t) represents time, while the vertical axis (x) represents position. ### Graph Explanations: 1. **Graph 1:** - A straight horizontal line, indicating constant position over time. 2. **Graph 2:** - A curve that starts with a shallow slope, steepens as time progresses. - Shows acceleration. 3. **Graph 3:** - A straight line with a positive slope. - Consistent, positive velocity. 4. **Graph 4:** - A straight line with a negative slope. - Consistent, negative velocity. 5. **Graph 5:** - A curve that starts steep and slowly levels out to flat. - Deceleration. 6. **Graph 6:** - A steep curve that becomes less steep over time. - Deceleration or a slowing rate of position change. ### Questions for Analysis: 1. **Starting point: \(x_0\)** - Identify the initial position on each graph. 2. **Position after time \(t\):** - Determine the final position reached after a specified time interval. 3. **Is the car heading in the positive or negative direction? Explain.** - Evaluate whether the graph shows motion in the positive or negative direction based on the slope. 4. **Is the car speeding up, slowing down (decelerating), or moving with constant velocity? Explain.** - Analyze the shapes of the graphs for changes in velocity. 5. **On the x-t graphs, identify locations where the rate of change of \(x\) with time is large and small.** - Locate areas with steep slopes (large rate of change) and flat sections (small rate of change).
Expert Solution
Step 1: Determine the given data and review the guidelines:

Physics homework question answer, step 1, image 1

Your question has 6 parts, For each part there are 5 different questions. So we will solve first three as per the Q&A guidelines. Please resubmit the last three parts in a new session.

steps

Step by step

Solved in 5 steps with 7 images

Blurred answer
Knowledge Booster
Displacement, velocity and acceleration
Learn more about
Need a deep-dive on the concept behind this application? Look no further. Learn more about this topic, physics and related others by exploring similar questions and additional content below.
Similar questions
  • SEE MORE QUESTIONS
Recommended textbooks for you
College Physics
College Physics
Physics
ISBN:
9781305952300
Author:
Raymond A. Serway, Chris Vuille
Publisher:
Cengage Learning
University Physics (14th Edition)
Physics
ISBN:
9780133969290
Author:
Hugh D. Young, Roger A. Freedman
Publisher:
PEARSON
Introduction To Quantum Mechanics
Physics
ISBN:
9781107189638
Author:
Griffiths, David J., Schroeter, Darrell F.
Publisher:
Cambridge University Press
Physics for Scientists and Engineers
Physics
ISBN:
9781337553278
Author:
Raymond A. Serway, John W. Jewett
Publisher:
Cengage Learning
Lecture- Tutorials for Introductory Astronomy
Physics
ISBN:
9780321820464
Author:
Edward E. Prather, Tim P. Slater, Jeff P. Adams, Gina Brissenden
Publisher:
Addison-Wesley
College Physics: A Strategic Approach (4th Editio…
Physics
ISBN:
9780134609034
Author:
Randall D. Knight (Professor Emeritus), Brian Jones, Stuart Field
Publisher:
PEARSON