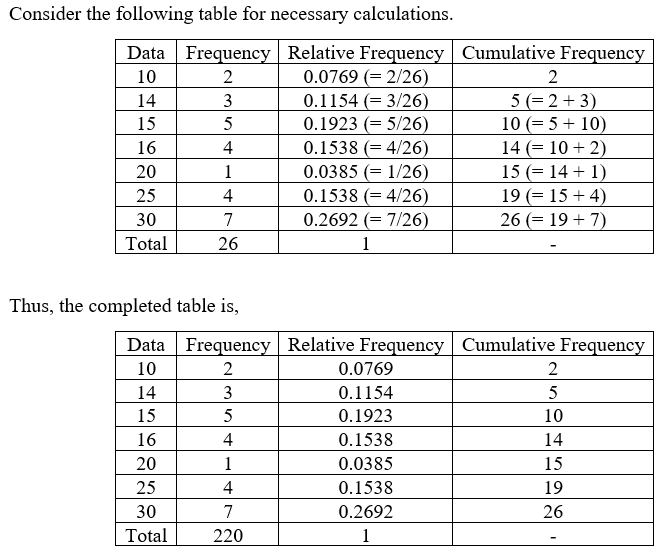
3) Consider the following frequency table: Data Frequency Relative frequency Cumulative relative frequency 10 2 14 3 15 5 16 20 1 25 4 30 7 a) Fill in the columns b) Construct a Relative Frequency Bar Chart c) Calculate the Mean and Median and the Mode d) Calculate the sample standard deviation (as if the data was a random sample of a population) e) Calculate the 30th Percentile | f) Calculate the sample z – score which corresponds to the raw score of x = 10 41

Note:
Hi there! Thank you for posting the question. As there are multiple sub parts, according to our policy we have solved the first three sub parts. If you need help with other sub parts, please re post separately.
a.
The frequency of a class or observation is the number of values corresponding to it.
The cumulative frequency of that class or observation is the sum of the frequencies up to that particular observation, including that of the observation, in an ordered (increasing or decreasing) arrangement of the data.
The relative frequency of a certain class or observation in a data set is obtained by dividing the class or observation frequency by total frequency.
The sum of relative frequencies is equal to 1.

Step by step
Solved in 4 steps with 4 images


