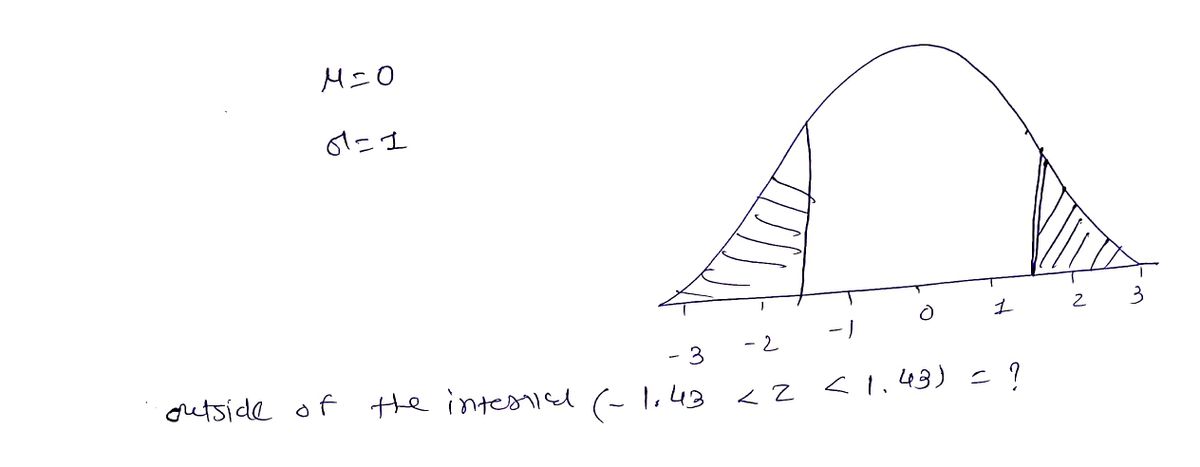
-3 -2 -1 0 1 2 3 Please show your answer to 2 decimal places. About % of the area under the curve of the standard normal distribution (µ = 0 and o = 1) is butside the interval Z = (-1.43,1.43) (or beyond 1.43 standard deviations of the mean).
Q: Using the z-distribution chart, what is the area to the left for z = -1.37? Express
A:
Q: A liquid-dispensing machine has been designed to fill bottles with 1.0 liter of liquid. The standard…
A: It is required to determine whether the process is in control or out of control, based on the given…
Q: IQ s normally distributed with a mean of 100 and a standard deviation of 15. Suppose one individual…
A: GivenMean(μ)=100standard deviation(σ)=15
Q: n = 22, ππ = .75 (Round your mean value to 2 decimal places and standard deviation to 4 decimal…
A:
Q: Find the indicated area under the curve of the standard normal distribution; then convert it to a…
A: The curve is not shown but it is clearly indicated that area under the normal curve between -2 and 2…
Q: Find the area of the shaded region. The graph depicts the standard normal distribution with mean 0…
A: Given That : Mean = 0 Standard Deviation = 1 Z Value (From the image ) = 0.51
Q: In families consisting of a couple with children, X, the age of the mother at the birth of her first…
A: Hi! Thank you for the question, As per the honour code, we are allowed to answer three sub-parts at…
Q: 0035 Click here to view.page 1 of the standard normal table Click here to view page 2 of the…
A:
Q: Find the area of the shaded region. The graph depicts the standard normal distribution of bone…
A: We have given the standard normal distribution. Bone density score with, mean = 0 and standard…
Q: Find endpoints on a standard normal distribution with the given property. The area between +z is…
A: Let the random variable Z follows Nμ=0,σ=1 Consider that the area between ±z is about 0.68 That is,
Q: Find the area of the shaded region. The graph depicts the standard normal distribution of bone…
A: Answer:- Given, The standard normal distribution of bone density scores with mean 0 and standard…
Q: e gas mileage of a certain vehicle make has a normal distribution such that N(25,3). Find the gas…
A: N [25,3]The population mean = 25The population standard deviation = 3
Q: About% of the area is between z=-1and z=1 (or within 1 standard deviation of the mean). (Round to…
A: here given z = 1 and z= -1 area between two z score value represent by probability .
Q: Find the Mean In a normal distribution, find μ when σ is 6 and 4.85% of the area lies to the left of…
A: Let X be the random variable from normal distribution with mean μ and standard deviation (σ) = 6…
Q: Find the area of the shaded region under the standard normal curve. If convenient, use technology to…
A: Required probability is P(-2.15<Z<0)
Q: Find the area of the shaded region. The graph depicts the standard normal distribution of bone…
A:
Q: Overproduction of uric acid in the body can be an indication of cell breakdown. This may be an…
A: It is given that the sample mean is 5.37 and the population standard deviation is 1.77.
Q: Weights of bags of sugar, X in kilograms (kg), from a manufacturer, are normally distributed with a…
A: Answer:- Given, Weights of bags of sugar, X in kilograms (kg), from a manufacturer, are normally…
Q: Find the area of the shaded region. The graph depicts the standard normal distribution with mean 0…
A: The area of the shaded region under the curve to the left of Z equals 0.26 is obtained below as…
Q: Find endpoints on a standard normal distribution with the given property. The area between +/- z is…
A: Given: The standard normal PZ1<Z<Z2=0.88 PZ1<Z<0=P0<Z<Z2
Q: rd normal dist
A: Z score is used as a score used to measure by how many units the value of a raw score is above or…
Q: Find the area of the shaded region. The graph depicts the standard normal distribution of bone…
A:
Q: A liquid-dispensing machine has been designed to fill bottles with 1.0 liter of liquid. The standard…
A: It is required to determine whether the process is in control or out of control, based on the given…
Q: % of the area under the curve of the standard normal distribution is between About 2 = -2.976 and z…
A:
Q: Please help
A: a.) The area either to the left of -1.69 or to the right of 1.09 is 0.1834See graph in the…
Q: For a recent English exam, use the Normal model N(73, 9.2) to find the proportion of scores under…
A: From the provided information. Mean (x) = 73 And standard deviation (s) = 9.2 Let Y be a random…
Q: Find the area under the standard normal distribution curve to the right of z= 1.74. A link to the…
A:
Q: is normally distributed with mean ?= 60 and standard deviation ?= 3. Find the 65th percentile.…
A:
Q: Find the indicated area under the curve of the standard normal distribution; then convert it to a…
A:
Step by step
Solved in 2 steps with 2 images
- Find the area of the shaded region. Assume the curve is a standard normal distribution with mean 0 and standard deviation 1. Round your answer to 4 decimal places.Previous answer was incorrectHayley has 120 apple trees of a certain variety in her orchard. She estimates the population of apples has a mean of 9 seeds per apple with a standard deviation of 2 seeds. The distribution in the number of seeds per apple has a shape that is approximately normal. The table gives the standard normal distribution. What percent of Hayley's apples have between 5 and 11 seeds? Enter your answer in the box rounded to the tenths place.
- uppose the lengths of human pregnancies are normally distributed with μ=266 days and σ=16 days. Complete parts (a) and (b) below. (a) The figure to the right represents the normal curve with μ=266 days and σ=16 days. The area to the left of X=235 is 0.0263. Provide two interpretations of this area. Provide one interpretation of the area using the given values. Select the correct choice below and fill in the answer boxes to complete your choice. (Type integers or decimals.) A. The proportion of human pregnancies that last more than nothing days is nothing. B. The proportion of human pregnancies that last less than days is X 266 235 A normal curve has a horizontal axis labeled "X" and two horizontal coordinates, 235 and 266. The curve's peak is near the top of the graph at horizontal coordinate 266. Two vertical line segments run from the horizontal axis to the curve at 235 and 266. The area under the curve to…I got it wrong, please help with explanation step by step.Overproduction of uric acid in the body can be an indication of cell breakdown. This may be an advance indication of illness such as gout, leukemia, or lymphoma.t Over a period of months, an adult male patient has taken seven blood tests for uric acid. The mean concentration was x = 5.29 mg/dl. The distribution of uric acid in healthy adult males can be assumed to be normal, with o = 1.95 mg/dl. (a) Find a 95% confidence interval for the population mean concentration of uric acid in this patient's blood. What is the margin of error? (Round your answers to two decimal places.) lower limit upper limit margin of error (b) What conditions are necessary for your calculations? (Select all that apply.) On is large O o is known O o is unknown O normal distribution of uric acid O uniform distribution of uric acid (c) Interpret your results in the context of this problem. O we are 95% confident that the true uric acid level for this patient falls within this interval. O we are 5% confident that…
- A normal distribution with a mean of 2mm and a standard deviation of 0.05mm a randomly generated number of 0.71 , need to calculate the standardised Z value, from my notes Z = (actual value - mean)/standard deviation. do i take the randomly generated number of 0.81 as the actual value ?Find the area of the shaded region. The graph depicts the standard normal distribution of bone density scores with mean 0 and standard deviation 1. 2= -0.81 z=1.21 The area of the shaded region is (Round to four decimal places as needed.)Overproduction of uric acid in the body can be an indication of cell breakdown. This may be an advance indication of illness such as gout, leukemia, or lymphoma.t Over a period of months, an adult male patient has taken nine blood tests for uric acid. The mean concentration was x = 5.41 mg/dl. The distribution of uric acid in healthy adult males can be assumed to be normal, with o = 1.75 mg/dl. (a) Find a 95% confidence interval for the population mean concentration of uric acid in this patient's blood. What is the margin of error? (Round your answers to two decimal places.) lower limit upper limit margin of error (b) What conditions are necessary for your calculations? (Select all that apply.) normal distribution of uric acid On is large O o is unknown O uniform distribution of uric acid O o is known (c) Interpret your results in the context of this problem. The probability that this interval contains the true average uric acid level for this patient is 0.95. The probability that this…
- I need help with the last 3 please.Find the area of the shaded region. The graph to the right depicts IQ scores of adults, and those scores are normally distributed with a mean of 100 and a standard deviation of 15. Click to view page 1 of th - × The area of the shaded r Standard Normal Table (Page 1) NEGATIVE z Scores Standard Normal (z) Distribution: Cumulative Area from the LEFT .00 .01 02 .03 .04 .05 .06 .07 .08 .09 -3.50 and lower .0001 -3.4 .0003 .0003 .0003 .0003 .0003 .0003 -3.3 .0005 .0005 .0005 .0004 .0004 .0004 .0003 0004 .0003 .0004 .0003 .0004 .0002 .0003 -3.2 .0007 .0007 .0006 0006 .0006 .0006 .0006 .0005 .0005 .0005 -3.1 .0010 .0009 .0009 .0009 .0008 .0008 .0008 .0008 0007 .0007 -3.0 .0013 .0013 0013 .0012 0012 .0011 .0011 .0011 0010 0010 -2.9 .0019 0018 0018 .0017 .0016 .0016 .0015 .0015 .0014 .0014 -2.8 .0026 .0025 .0024 .0023 .0023 .0022 .0021 .0021 .0020 .0019 -2.7 .0035 .0034 .0033 .0032 .0031 .0030 .0029 .0028 .0027 .0026 -2.6 .0047 .0045 0044 .0043 .0041 .0040 .0039 .0038 .0037 .0036 -2.5 .0062…