27 34 36 36 42 48 54 60 86 ange: (Please ent
![**Statistical Analysis Exercise**
In this exercise, you'll calculate the range, sample standard deviation, and inter-quartile range (IQR) of a given data set.
**Data Set:**
\[ 27, 34, 36, 36, 42, 48, 54, 60, 86, 95 \]
**Tasks:**
1. **Calculate the Range**
- Enter the exact value.
2. **Calculate the Sample Standard Deviation (\(s\))**
- Round your answer to one decimal place.
3. **Calculate the Inter-Quartile Range (IQR)**
- Enter the exact value.
---
**Modification of Data Set:**
A new number, 207, is added to the original data set. Recalculate the following for the new data set:
1. **New Range**
- Enter the exact value.
2. **New Sample Standard Deviation**
- Round your answer to one decimal place.
3. **New Inter-Quartile Range (IQR)**
- Enter the exact value.
---
**Analysis Question:**
Which measure of spread is less affected by the addition of the extreme observation?
- Range
- IQR
- Standard deviation
Select the appropriate option.](/v2/_next/image?url=https%3A%2F%2Fcontent.bartleby.com%2Fqna-images%2Fquestion%2F0f725b05-6985-474e-a031-937034e54c0f%2F4fe9c0ae-be49-4fd4-babf-18bdf0246624%2Febn9a5g_processed.jpeg&w=3840&q=75)
We see that, the data set is arranged in ascending order.
Range is the difference between maximum and minimum data value. We see, Maximum=95 and Minimum=27. Hence, the range is calculated as;
Range=Maximum-Minimum
=95-27
=68
- Hence, Range=68
The general formula for standard deviation is; , where xi=data points, is the mean and n=sample size.
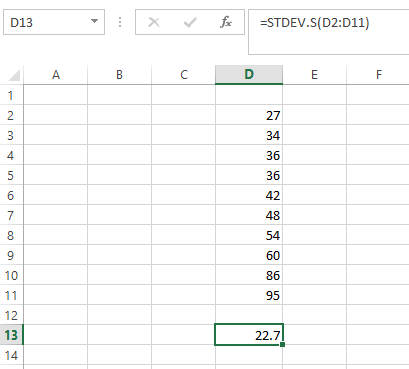
I will Use Excel to obtain the Standard deviation. Use the formula "=STDEV.S(Data set)" to obtain the standard deviation. The snip is attached as;

- Hence, Standard deviation (s)=22.7
IQR is the difference between the first quartile, i.e, Q1 and the third quartile, i.e, Q3.
As the total number of observations is 10 (even), we divide the data set into two equal half.
The lower half is 27,34,36,36,42 and the upper half is 48,54,60,86,95
Q1 is the median of the lower half, i.e, the middle value of lower half.
The median of lower half is 36, hence Q1=36
Q3 is the median of the upper half, i.e, the middle value of upper half.
The median of upper half is 60, hence Q3=60
Hence, the IQR is calculated as:
IQR=Q3-Q1
=60-36
=24
- Hence, IQR=24
Thus,
- Range=68
- s=22.7
- IQR=24
Step by step
Solved in 3 steps with 3 images


