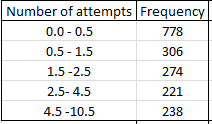
2.40 The accompanying frequency distribution sum- marizes data on the number of times smokers attempted to quit before their final successful attempt (“Demographic Variables, Smoking Variables, and Outcome Across Five Studies," Health Psychology [2007]: 278–287).


![li 2.40 The accompanying frequency distribution sum-
marizes data on the number of times smokers attempted
to quit before their final successful attempt ("Demographic
Variables, Smoking Variables, and Outcome Across Five
Studies," Health Psychology [2007]: 278-287).
Number of Attempts Frequency
778
1
306
2
274
3-4
221
5 or more
238
Assume that no one had made more than 10 unsuccessful
attempts, so that the last entry in the frequency distribution
can be regarded as 5–10 attempts. Summarize this data set](/v2/_next/image?url=https%3A%2F%2Fcontent.bartleby.com%2Fqna-images%2Fquestion%2F811f7a62-615c-46a8-8a14-8799dcbbd98a%2Fb4dc5aa9-8ab5-47b9-a584-ed1d9ac19b8c%2Frbj1oc6_processed.png&w=3840&q=75)

Here we are given the class interval and they are not all the same width.
It means that the difference between lower and upper limits are not same for the given number of attempts.
To check this we need to find
- Class boundaries.
- Relative frequency.
- Width.
- Density.
We can find the class boundaries by subtracting 0.5 units from the lower limits and adding 0.5 units from the upper limits.
Thus , for all number of attempts class boundaries are as follows;
For 0 , it would be like 0 - 0.5 , 0 + 0.5 = 0.0 to 0.5. [ Instead of -0.5 we'll write this as 0]
For 1 , it would be like 1-0.5 , 1 + 0.5 = 0.5 to 1.5.
For 2 , it would be like 2-0.5 , 2 +0.5 = 1.5 to 2.5.
For 3-4 , it would be like 3-0.5 , 4 +0.5 = 2.5 to 4.5.
For 5 or more , it would be 5-0.5 , 10+0.5 = 4.5 to 10.5.
Note : 5 or more means lower limit is 5 and upper limit is 10 and it can be written as 5-10.
It will look like,
To find the relative frequency, divide the frequency by the total number of data values/frequencies.
Here total number of data values = 778 +306 + 274 +221 + 238 = 1817.
Therefore , Σf = n = 1817.
Thus , the relative frequencies are as follows;
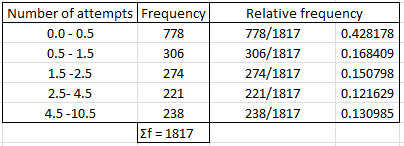
Note : The sum of relative frequency should be equal to 1.

Step by step
Solved in 6 steps with 6 images


