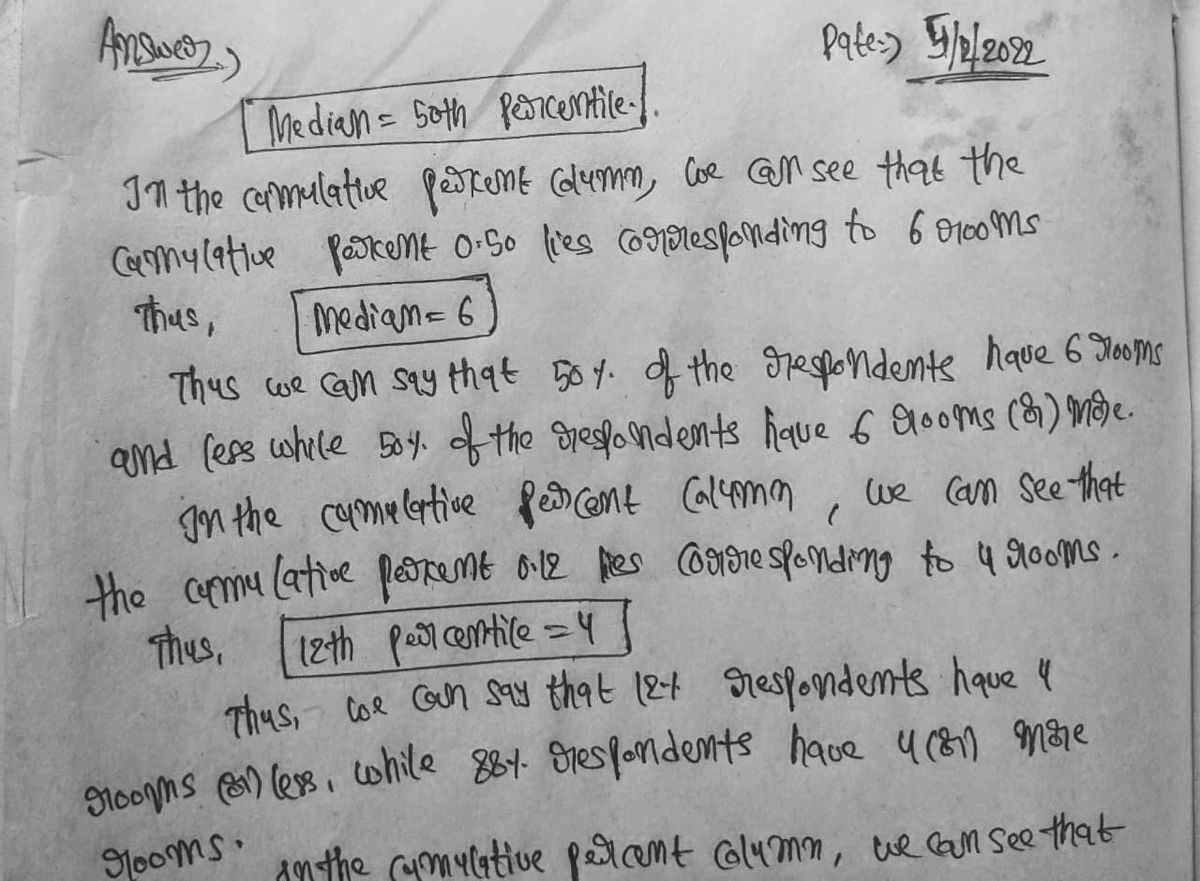
2. Using the frequency/percentage distribution table below to find the median, 12h percentile, 25h percentile (1" quartile), 75h percentile (3rd quartile) and inter-quartile range (1QR) for the variable "number of rooms tn respondents' home or apartment." Write one sentence interpreting each statistics. Number of rooms Cumulative Frequency Percent Valid Percent Percent Valid 1 room 153 .7 .8 8 244 1.2 1.2 2.0 968 4.7 4.9 6.9 2507 12.1 12.8 19.7 3758 18.1 19.1 38.8 3972 19.1 20.2 59.1 2965 14.3 15.1 74.2 2186 10.5 11.1 85.3 1146 5.5 5.8 91.1 10 868 4.2 4.4 95.5 11 373 1.8 1.9 97.4 12 217 1.0 1.1 98.5 13 77 .4 98.9 14 35 99.1 15 22 .1 99.2 16 15 .1 99.3 17 47 99.5 18 40 99.8 19 30 .1 99.9 20 99.9 21 5 .0 .0 100.0 22 5. .0 100.0 Total 19642 94.4 100.0 Missing N/A 1160 5.6 Total 20802 100.0
2. Using the frequency/percentage distribution table below to find the median, 12h percentile, 25h percentile (1" quartile), 75h percentile (3rd quartile) and inter-quartile range (1QR) for the variable "number of rooms tn respondents' home or apartment." Write one sentence interpreting each statistics. Number of rooms Cumulative Frequency Percent Valid Percent Percent Valid 1 room 153 .7 .8 8 244 1.2 1.2 2.0 968 4.7 4.9 6.9 2507 12.1 12.8 19.7 3758 18.1 19.1 38.8 3972 19.1 20.2 59.1 2965 14.3 15.1 74.2 2186 10.5 11.1 85.3 1146 5.5 5.8 91.1 10 868 4.2 4.4 95.5 11 373 1.8 1.9 97.4 12 217 1.0 1.1 98.5 13 77 .4 98.9 14 35 99.1 15 22 .1 99.2 16 15 .1 99.3 17 47 99.5 18 40 99.8 19 30 .1 99.9 20 99.9 21 5 .0 .0 100.0 22 5. .0 100.0 Total 19642 94.4 100.0 Missing N/A 1160 5.6 Total 20802 100.0

MATLAB: An Introduction with Applications
6th Edition
ISBN:9781119256830
Author:Amos Gilat
Publisher:Amos Gilat
Chapter1: Starting With Matlab
Section: Chapter Questions
Problem 1P

Related questions
Question

Transcribed Image Text:2. Using the frequency/percentage distribution table below to find the median, 12t
percentile, 25th percentile (1" quartile), 75th percentile (3rd quartile) and inter-quartile
range (1QR) for the variable "mumber of rooms in respondents' home or apartment."
Write one sentence interpreting each statistics.
Number of rooms
Cumulative
Frequency
Percent
Valid Percent
Percent
Valid
153
room
7
.8
.8
244
1.2
1.2
2.0
3
968
4.7
4.9
6.9
2507
12.1
12.8
19.7
3758
18.1
19.1
38.8
3972
19.1
20.2
59.1
2965
14.3
15.1
74.2
2186
10.5
11.1
85.3
1146
5.5
5.8
91.1
10
868
4.2
4.4
95.5
11
373
1.8
1.9
97.4
12
217
1.0
1.1
98.5
13
77
4
4
98.9
14
35
2
99.1
15
22
.1
.1
99.2
16
15
.1
.1
99.3
17
47
2
99.5
18
40
2
99.8
19
30
.1
99.9
20
9
.0
.0
99.9
21
5
100.0
22
.0
100.0
Total
19642
94.4
100.0
Missing
N/A
1160
5.6
Total
20802
100.0
Expert Solution
Step 1

Step by step
Solved in 2 steps with 2 images

Recommended textbooks for you
MATLAB: An Introduction with Applications
Statistics
ISBN:
9781119256830
Author:
Amos Gilat
Publisher:
John Wiley & Sons Inc

Probability and Statistics for Engineering and th…
Statistics
ISBN:
9781305251809
Author:
Jay L. Devore
Publisher:
Cengage Learning

Statistics for The Behavioral Sciences (MindTap C…
Statistics
ISBN:
9781305504912
Author:
Frederick J Gravetter, Larry B. Wallnau
Publisher:
Cengage Learning
MATLAB: An Introduction with Applications
Statistics
ISBN:
9781119256830
Author:
Amos Gilat
Publisher:
John Wiley & Sons Inc
Probability and Statistics for Engineering and th…
Statistics
ISBN:
9781305251809
Author:
Jay L. Devore
Publisher:
Cengage Learning
Statistics for The Behavioral Sciences (MindTap C…
Statistics
ISBN:
9781305504912
Author:
Frederick J Gravetter, Larry B. Wallnau
Publisher:
Cengage Learning

Elementary Statistics: Picturing the World (7th E…
Statistics
ISBN:
9780134683416
Author:
Ron Larson, Betsy Farber
Publisher:
PEARSON

The Basic Practice of Statistics
Statistics
ISBN:
9781319042578
Author:
David S. Moore, William I. Notz, Michael A. Fligner
Publisher:
W. H. Freeman

Introduction to the Practice of Statistics
Statistics
ISBN:
9781319013387
Author:
David S. Moore, George P. McCabe, Bruce A. Craig
Publisher:
W. H. Freeman