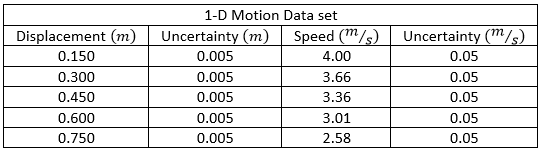
2. In a 1-D motion lab the students launch a cart along a horizontal air track and measure the speed of the cart at various displacements from the launcher. The following set of data indicates the speed with uncertainty for the cart to travel through the displacement with uncertainty. In an excel spreadsheet produce a graph of the data such that the slope of the relationship that is graphed is the acceleration of the cart along the air track. Be sure to show your error bars on the data in the graph and have excel calculate the standard error in both the slope and y-intercept (use the LINEST function). Use your results to determine the magnitude of the acceleration of the cart with uncertainty and the initial speed of the cart with uncertainty. Displacement (m) 0.150 0.300 0.450 0.600 0.750 1-D Motion Data Set Uncertainty (m) 0.005 0.005 0.005 0.005 0.005 Speed (m/s) 4.00 3.66 3.36 3.01 2.58 Uncertainty (m/s) 0.05 0.05 0.05 0.05 0.05
2. In a 1-D motion lab the students launch a cart along a horizontal air track and measure the speed of the cart at various displacements from the launcher. The following set of data indicates the speed with uncertainty for the cart to travel through the displacement with uncertainty. In an excel spreadsheet produce a graph of the data such that the slope of the relationship that is graphed is the acceleration of the cart along the air track. Be sure to show your error bars on the data in the graph and have excel calculate the standard error in both the slope and y-intercept (use the LINEST function). Use your results to determine the magnitude of the acceleration of the cart with uncertainty and the initial speed of the cart with uncertainty. Displacement (m) 0.150 0.300 0.450 0.600 0.750 1-D Motion Data Set Uncertainty (m) 0.005 0.005 0.005 0.005 0.005 Speed (m/s) 4.00 3.66 3.36 3.01 2.58 Uncertainty (m/s) 0.05 0.05 0.05 0.05 0.05

Related questions
Question

Transcribed Image Text:2. In a 1-D motion lab the students launch a cart along a horizontal air track and
measure the speed of the cart at various displacements from the launcher. The
following set of data indicates the speed with uncertainty for the cart to travel
through the displacement with uncertainty. In an excel spreadsheet produce a
graph of the data such that the slope of the relationship that is graphed is the
acceleration of the cart along the air track. Be sure to show your error bars on the
data in the graph and have excel calculate the standard error in both the slope and
y-intercept (use the LINEST function). Use your results to determine the
magnitude of the acceleration of the cart with uncertainty and the initial speed of
the cart with uncertainty.
Displacement (m)
0.150
0.300
0.450
0.600
0.750
1-D Motion Data Set
Uncertainty (m)
0.005
0.005
0.005
0.005
0.005
Speed (m/s)
4.00
3.66
3.36
3.01
2.58
Uncertainty (m/s)
0.05
0.05
0.05
0.05
0.05
Expert Solution
Step 1
Given:
Here is the given table of data,
To determine:
- The magnitude of the acceleration of the cart.
- The initial speed of the cart.

Trending now
This is a popular solution!

Step by step
Solved in 6 steps with 5 images
