2. For each of the following datasets, identify any regression outliers and any influential observations. Remember that regression outliers are data points that appear to deviate from the trend of the data. Influential observations are data points whose removal would have a significant effect on the regression model. Influential observations often also have high leverage, meaning they tend to appear far in the horizontal direction from the other data values. a. x (independent) 8 y (dependent) 9. 1 4.2 5.5 7.7 19 44 -11 -13 4.9 -1.6 -4 -26 -30 -81 C18 SA18-1921 C17 204 40 b. x (independent) 12.2 16.9 21.7 22.5 25.4 30 55 62 y (dependent) 5 8 13.8 14 15.2 C14120s 0200 C15 6.
2. For each of the following datasets, identify any regression outliers and any influential observations. Remember that regression outliers are data points that appear to deviate from the trend of the data. Influential observations are data points whose removal would have a significant effect on the regression model. Influential observations often also have high leverage, meaning they tend to appear far in the horizontal direction from the other data values. a. x (independent) 8 y (dependent) 9. 1 4.2 5.5 7.7 19 44 -11 -13 4.9 -1.6 -4 -26 -30 -81 C18 SA18-1921 C17 204 40 b. x (independent) 12.2 16.9 21.7 22.5 25.4 30 55 62 y (dependent) 5 8 13.8 14 15.2 C14120s 0200 C15 6.

MATLAB: An Introduction with Applications
6th Edition
ISBN:9781119256830
Author:Amos Gilat
Publisher:Amos Gilat
Chapter1: Starting With Matlab
Section: Chapter Questions
Problem 1P

Related questions
Question

Transcribed Image Text:Normal
No Spacing
Heading 1
Editing
Dictate
Styles
Voice
Sens
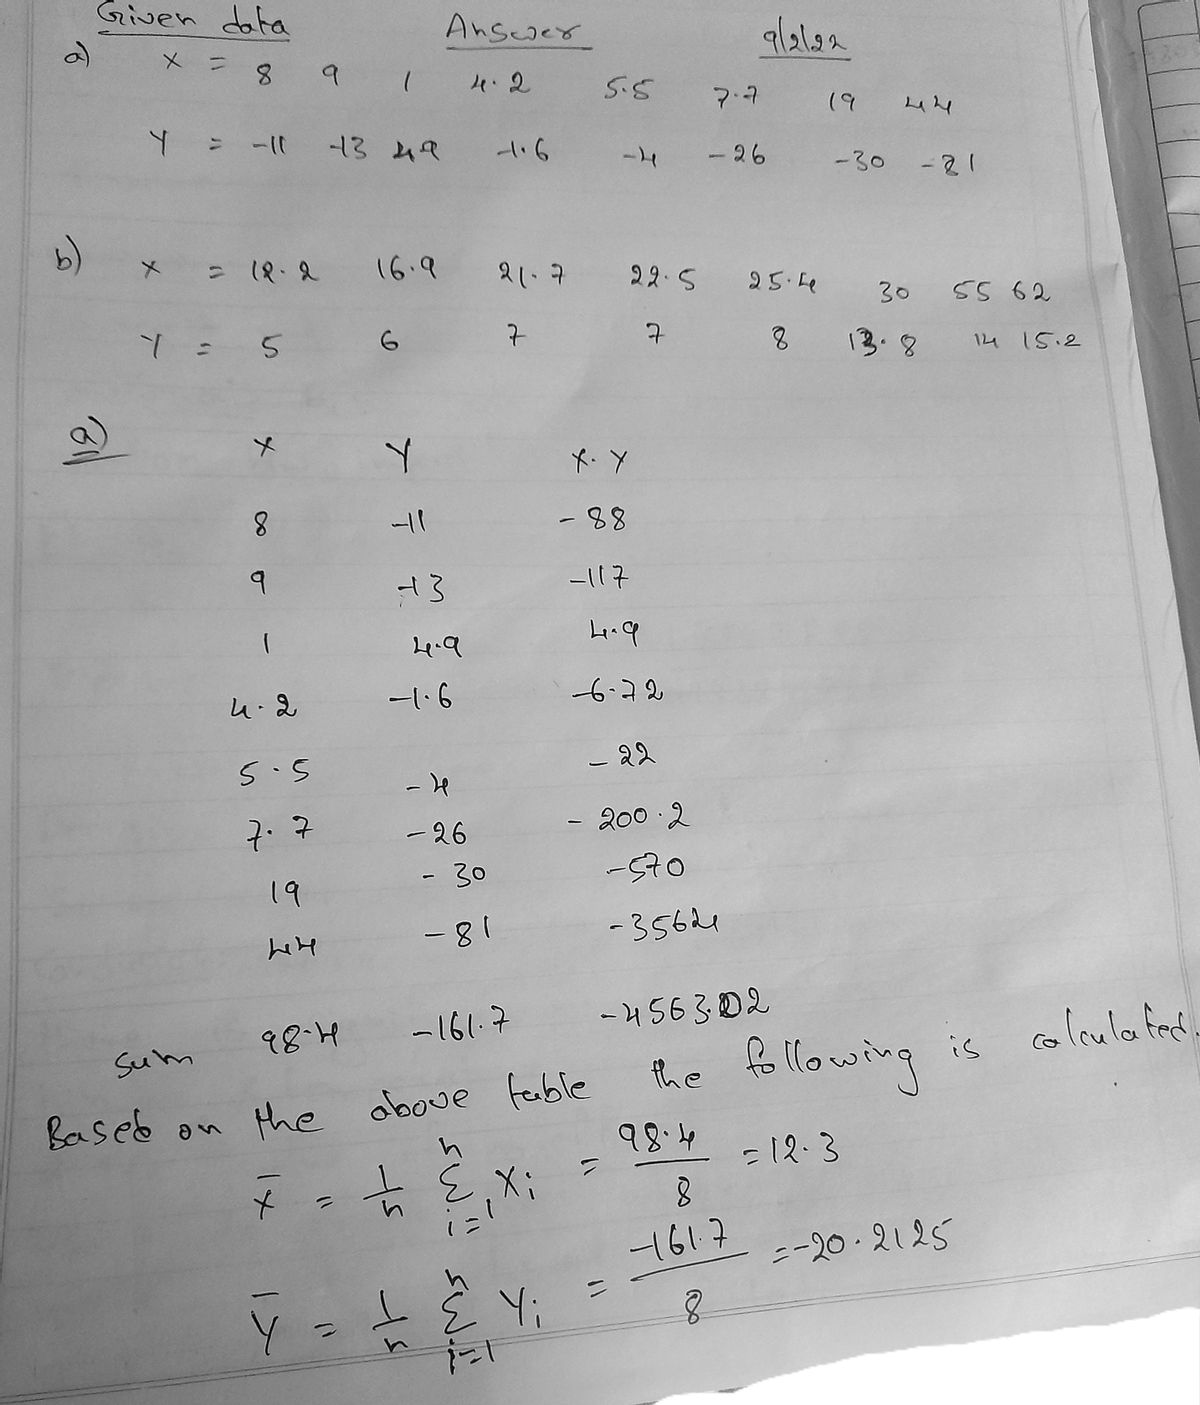
2. For each of the following datasets, identify any regression outliers and any
influential observations. Remember that regression outliers are data points that
appear to deviate from the trend of the data. Influentiaí observations are data
points whose removal would have a significant effect on the regression model.
Influential observations often also have high leverage, meaning they tend to
appear far in the horizontal direction from the other data values.
a.
x (independent)
9
1
4.2
5.5
7.7
19
44
y (dependent)
-11
-13
4.9
-1.6
-4
-26
-30
-81
C18 SA18 - 1 921 C17
40
b.
x (independent) 12.2
y (dependent)
16.9
21.7
22.5
25.4
30
55
62
6.
7.
13.8
14
15.2
OFocus
Expert Solution
Step 1

Trending now
This is a popular solution!

Step by step
Solved in 4 steps with 4 images

Recommended textbooks for you
MATLAB: An Introduction with Applications
Statistics
ISBN:
9781119256830
Author:
Amos Gilat
Publisher:
John Wiley & Sons Inc

Probability and Statistics for Engineering and th…
Statistics
ISBN:
9781305251809
Author:
Jay L. Devore
Publisher:
Cengage Learning

Statistics for The Behavioral Sciences (MindTap C…
Statistics
ISBN:
9781305504912
Author:
Frederick J Gravetter, Larry B. Wallnau
Publisher:
Cengage Learning
MATLAB: An Introduction with Applications
Statistics
ISBN:
9781119256830
Author:
Amos Gilat
Publisher:
John Wiley & Sons Inc
Probability and Statistics for Engineering and th…
Statistics
ISBN:
9781305251809
Author:
Jay L. Devore
Publisher:
Cengage Learning
Statistics for The Behavioral Sciences (MindTap C…
Statistics
ISBN:
9781305504912
Author:
Frederick J Gravetter, Larry B. Wallnau
Publisher:
Cengage Learning

Elementary Statistics: Picturing the World (7th E…
Statistics
ISBN:
9780134683416
Author:
Ron Larson, Betsy Farber
Publisher:
PEARSON

The Basic Practice of Statistics
Statistics
ISBN:
9781319042578
Author:
David S. Moore, William I. Notz, Michael A. Fligner
Publisher:
W. H. Freeman

Introduction to the Practice of Statistics
Statistics
ISBN:
9781319013387
Author:
David S. Moore, George P. McCabe, Bruce A. Craig
Publisher:
W. H. Freeman