2. Age and BMI of the 9 individuals are listed as follows. Analyze if there is any correlation between these two. If so, what type. BMI 20.1 Age 8 12 23 24 29 65 68 72 75 18.9 25.6 25.6 33.3 22 21 20 20 a. Comment whether age/gender is symmetric/asymmetric.
2. Age and BMI of the 9 individuals are listed as follows. Analyze if there is any correlation between these two. If so, what type. BMI 20.1 Age 8 12 23 24 29 65 68 72 75 18.9 25.6 25.6 33.3 22 21 20 20 a. Comment whether age/gender is symmetric/asymmetric.
A First Course in Probability (10th Edition)
10th Edition
ISBN:9780134753119
Author:Sheldon Ross
Publisher:Sheldon Ross
Chapter1: Combinatorial Analysis
Section: Chapter Questions
Problem 1.1P: a. How many different 7-place license plates are possible if the first 2 places are for letters and...
Related questions
Question
can you help me with a and b
please
step by step

Transcribed Image Text:**Age and BMI of Individuals**
The table below presents the Age and Body Mass Index (BMI) of 9 individuals. The aim is to analyze if there is any correlation between these two variables and, if so, to determine the type of correlation.
| Age | BMI |
|-----|------|
| 8 | 20.1 |
| 12 | 18.9 |
| 23 | 25.6 |
| 24 | 25.6 |
| 29 | 33.3 |
| 65 | 22 |
| 68 | 21 |
| 72 | 20 |
| 75 | 20 |
Additionally, consider whether the distribution of age (not gender, as incorrectly mentioned) is symmetric or asymmetric.
**Graph Analysis:**
This is a table and not a graph, so no graphical analysis is provided.
---
In analyzing correlation, one should consider plotting these values on a scatter plot to visually assess the relationship. Statistical methods such as calculating the Pearson correlation coefficient could also be used for a more precise understanding.
Expert Solution
Step 1
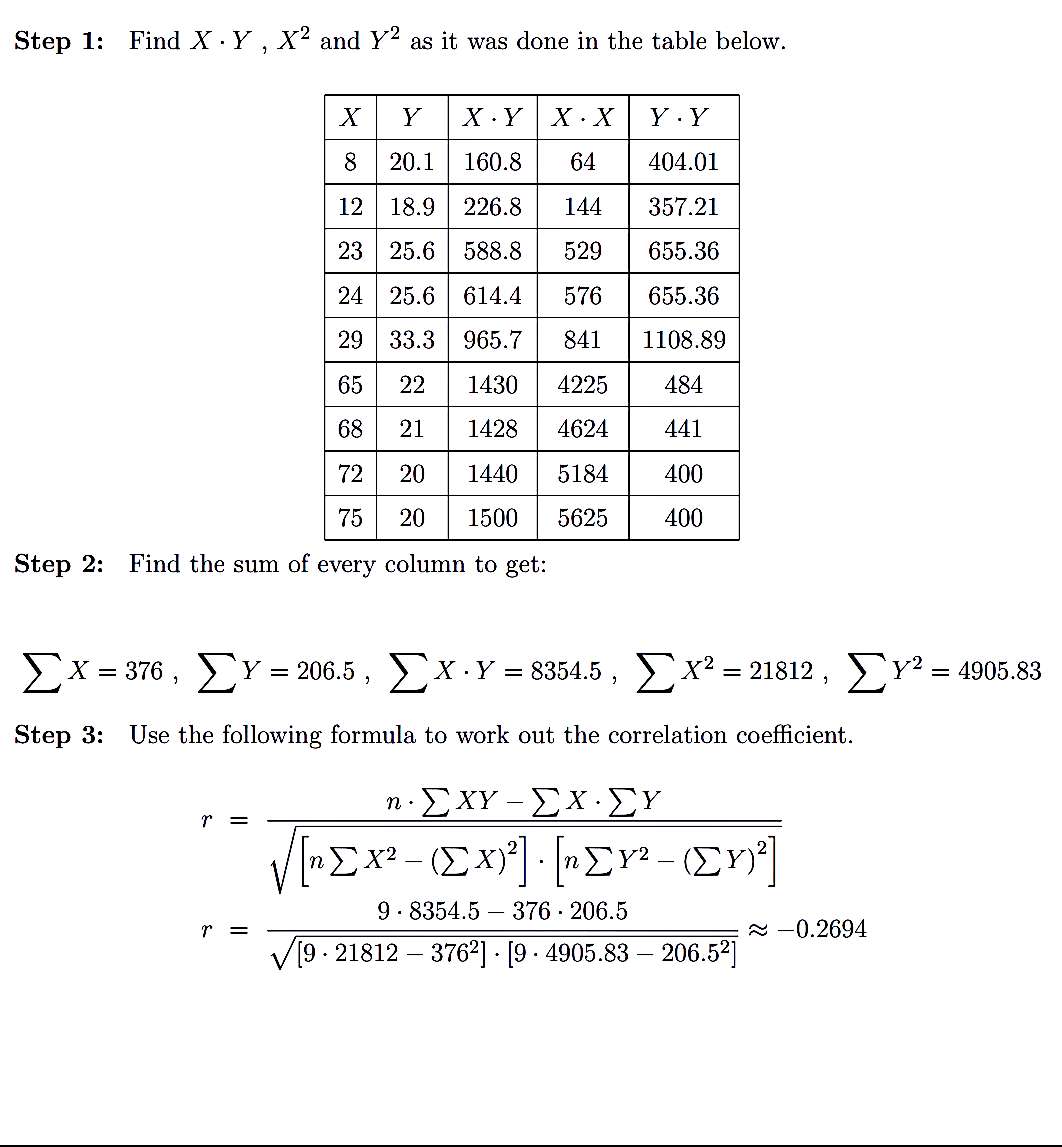
From the above data
Consider X independent variable is Age
And
Y Dependent variable is BMI

Step by step
Solved in 2 steps with 1 images

Recommended textbooks for you

A First Course in Probability (10th Edition)
Probability
ISBN:
9780134753119
Author:
Sheldon Ross
Publisher:
PEARSON


A First Course in Probability (10th Edition)
Probability
ISBN:
9780134753119
Author:
Sheldon Ross
Publisher:
PEARSON
