2. A smartphone manufacturer is advertising that its new smartphone has the best battery life. Thirty smartphones were randomly selected and the number of hours each smartphone lasted before reaching 0% battery is recorded below. A. Using the following distribution of battery life (in hours) of the latest new smartphone, construct a box & whisker plot on the graph paper and display the 5-number summary on the boxplot. BATTERY LIFE (IN NUMBER OF HOURS) 50, 25, 39, 37, 49, 48, 62, 44, 41, 34, 38, 39, 40, 49, 32, 36, 44, 49, 47, 44, 49, 46, 39, 38, 44, 45, 50, 43, 40, 42 (Σ- 1233 εnd Σx-56261 ) B. State the 5-Number Summary: Lower Quartile: Median: Upper Quartile: Min: Мах: C. State the shape of the Box Plot. D. What does the shape of the Box Plot indicate about the battery lives of the new smartphone? E. Using the modified box plot function of your TI Calculator modified box plot, determine if there are any outliers or potential outliers. If outlier(s) exist, then state the value of the outlier(s).
2. A smartphone manufacturer is advertising that its new smartphone has the best battery life. Thirty smartphones were randomly selected and the number of hours each smartphone lasted before reaching 0% battery is recorded below. A. Using the following distribution of battery life (in hours) of the latest new smartphone, construct a box & whisker plot on the graph paper and display the 5-number summary on the boxplot. BATTERY LIFE (IN NUMBER OF HOURS) 50, 25, 39, 37, 49, 48, 62, 44, 41, 34, 38, 39, 40, 49, 32, 36, 44, 49, 47, 44, 49, 46, 39, 38, 44, 45, 50, 43, 40, 42 (Σ- 1233 εnd Σx-56261 ) B. State the 5-Number Summary: Lower Quartile: Median: Upper Quartile: Min: Мах: C. State the shape of the Box Plot. D. What does the shape of the Box Plot indicate about the battery lives of the new smartphone? E. Using the modified box plot function of your TI Calculator modified box plot, determine if there are any outliers or potential outliers. If outlier(s) exist, then state the value of the outlier(s).

MATLAB: An Introduction with Applications
6th Edition
ISBN:9781119256830
Author:Amos Gilat
Publisher:Amos Gilat
Chapter1: Starting With Matlab
Section: Chapter Questions
Problem 1P

Related questions

Question

Transcribed Image Text:2. A smartphone manufacturer is advertising that its new smartphone has the best battery life. Thirty smartphones were
randomly selected and the number of hours each smartphone lasted before reaching 0% battery is recorded below.
A. Using the following distribution of battery life (in hours) of the latest new smartphone, construct a box & whisker plot
on the graph paper and display the 5-number summary on the boxplot.
BATTERY LIFE (IN NUMBER OF HOURS)
50, 25, 39, 37, 49, 48, 62, 44, 41, 34, 38, 39, 40, 49, 32, 36, 44, 49, 47, 44, 49, 46, 39, 38, 44, 45, 50, 43, 40, 42
(Σ- 1233 εnd Σx-56261 )
B. State the 5-Number Summary:
Lower Quartile:
Median:
Upper Quartile:
Min:
Мах:
C. State the shape of the Box Plot.
D. What does the shape of the Box Plot indicate about the battery lives of the new smartphone?
E. Using the modified box plot function of your TI Calculator modified box plot, determine if there are any outliers or
potential outliers. If outlier(s) exist, then state the value of the outlier(s).
Expert Solution
Step 1
Note:
Hi there! Thank you for positing the question. As there are multiple sub-parts, according to our policy we have solved the first three sub-parts. If you need help with other sub-parts, please re-post the questions separately.
Step 2
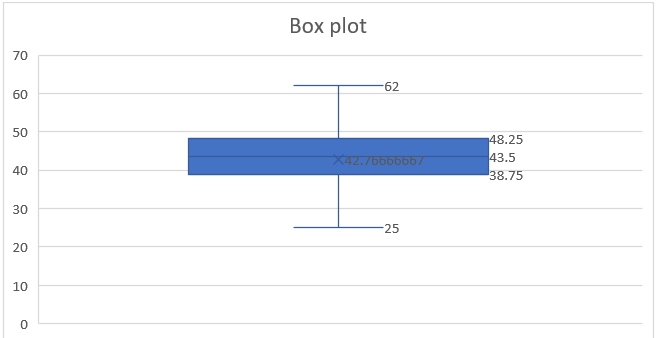
A.
Box plot:
Step by step procedure to obtain the box plot using Excel is given below:
- Enter the data in the an Excel sheet from the cell A1 to A31 with heading of Balance.
- Select the data.
- Select Insert > All charts > Box & Whisker.
- Click OK.
The boxplot is obtained below:

Step by step
Solved in 3 steps with 1 images

Knowledge Booster


Learn more about
Need a deep-dive on the concept behind this application? Look no further. Learn more about this topic, statistics and related others by exploring similar questions and additional content below.Recommended textbooks for you
MATLAB: An Introduction with Applications
Statistics
ISBN:
9781119256830
Author:
Amos Gilat
Publisher:
John Wiley & Sons Inc

Probability and Statistics for Engineering and th…
Statistics
ISBN:
9781305251809
Author:
Jay L. Devore
Publisher:
Cengage Learning

Statistics for The Behavioral Sciences (MindTap C…
Statistics
ISBN:
9781305504912
Author:
Frederick J Gravetter, Larry B. Wallnau
Publisher:
Cengage Learning
MATLAB: An Introduction with Applications
Statistics
ISBN:
9781119256830
Author:
Amos Gilat
Publisher:
John Wiley & Sons Inc
Probability and Statistics for Engineering and th…
Statistics
ISBN:
9781305251809
Author:
Jay L. Devore
Publisher:
Cengage Learning
Statistics for The Behavioral Sciences (MindTap C…
Statistics
ISBN:
9781305504912
Author:
Frederick J Gravetter, Larry B. Wallnau
Publisher:
Cengage Learning

Elementary Statistics: Picturing the World (7th E…
Statistics
ISBN:
9780134683416
Author:
Ron Larson, Betsy Farber
Publisher:
PEARSON

The Basic Practice of Statistics
Statistics
ISBN:
9781319042578
Author:
David S. Moore, William I. Notz, Michael A. Fligner
Publisher:
W. H. Freeman

Introduction to the Practice of Statistics
Statistics
ISBN:
9781319013387
Author:
David S. Moore, George P. McCabe, Bruce A. Craig
Publisher:
W. H. Freeman